Air Pollution in Lisbon
At our Enviro Bike Launch in Lisbon 2020 riders sonified and collected air pollution data across the city while they rode. When they returned to our lab we visualised the data too. Here are a selection of charts and 3D maps we looked at. Full data is available to download below.
Air Pollution on all rides
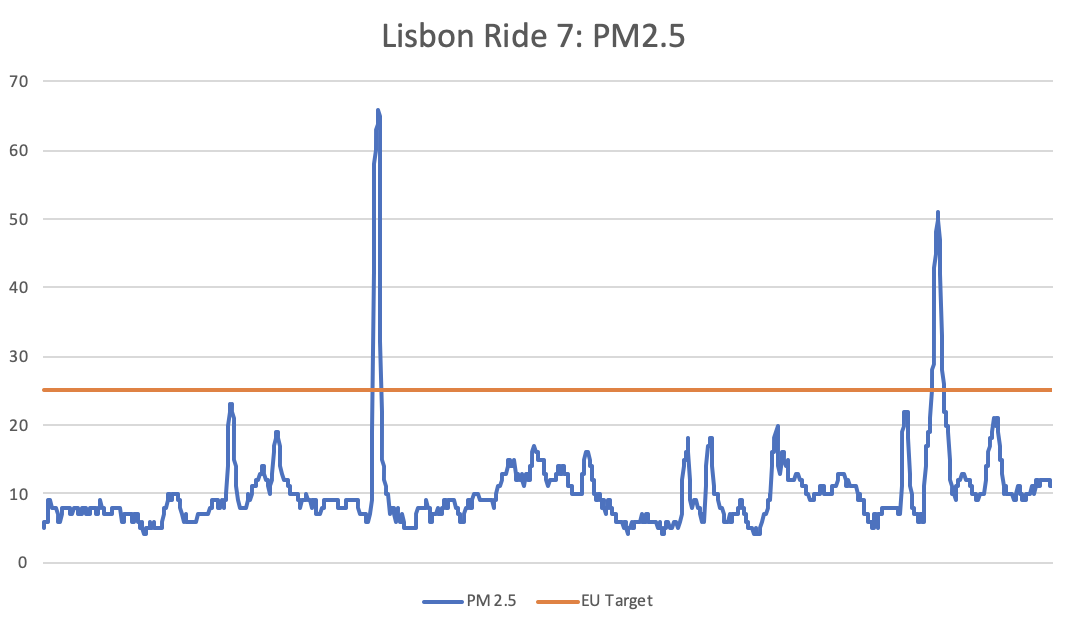
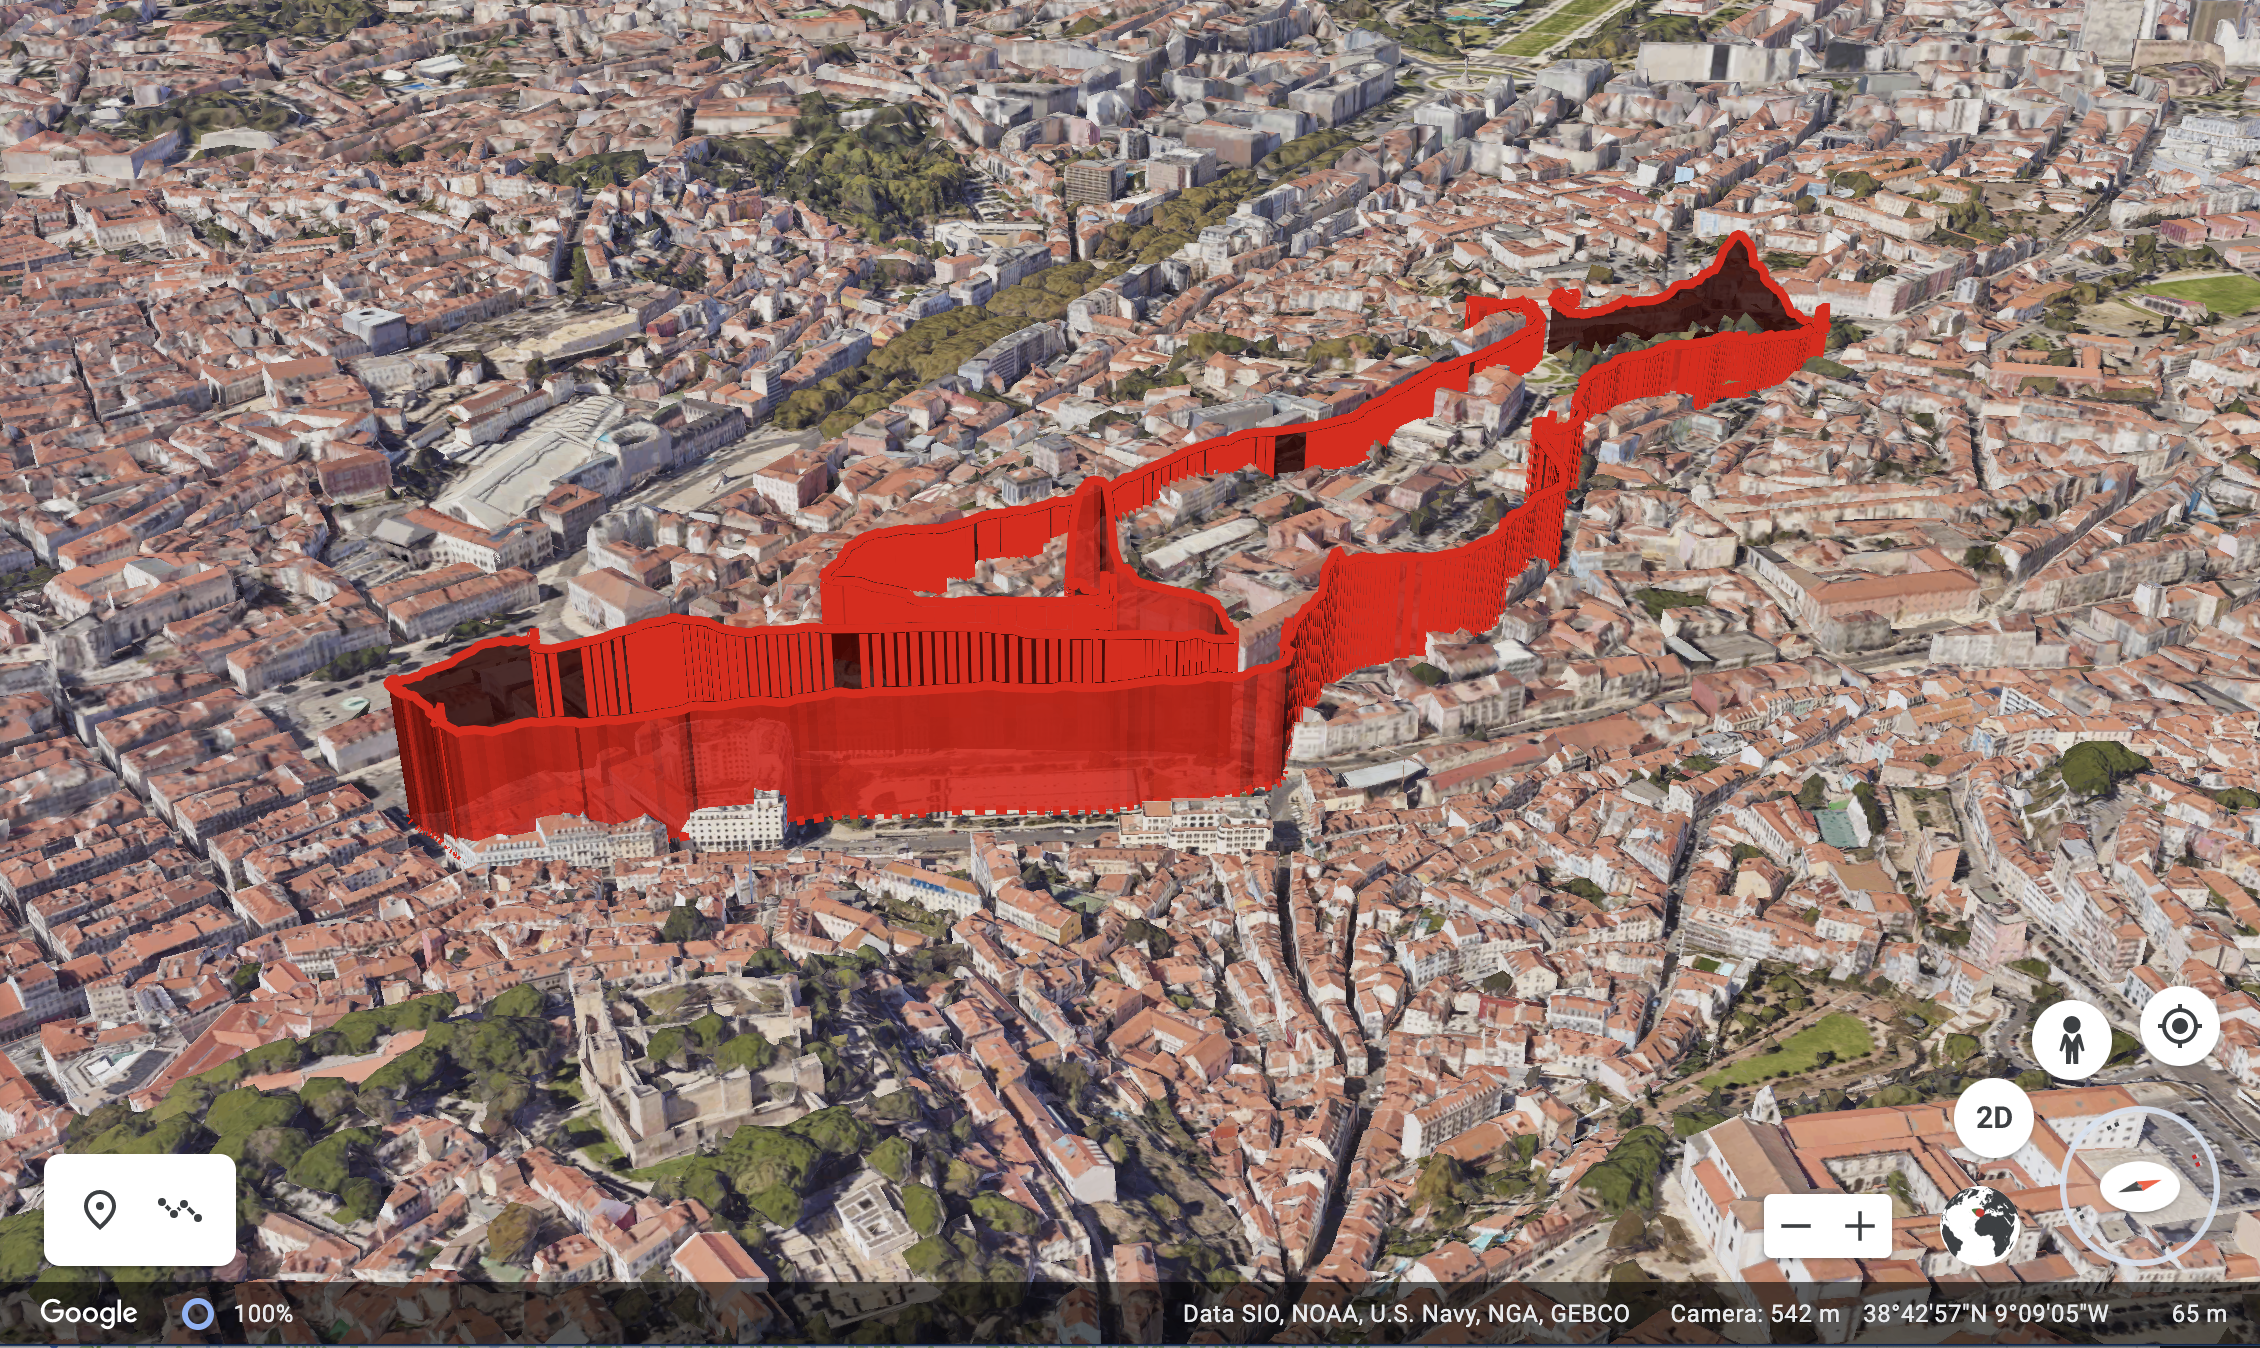
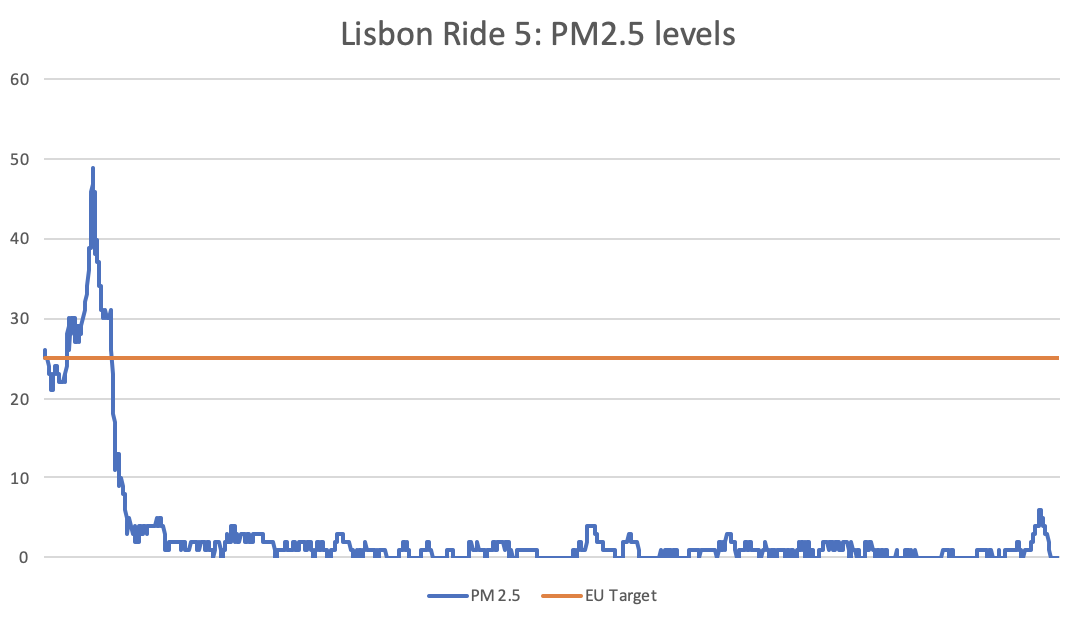
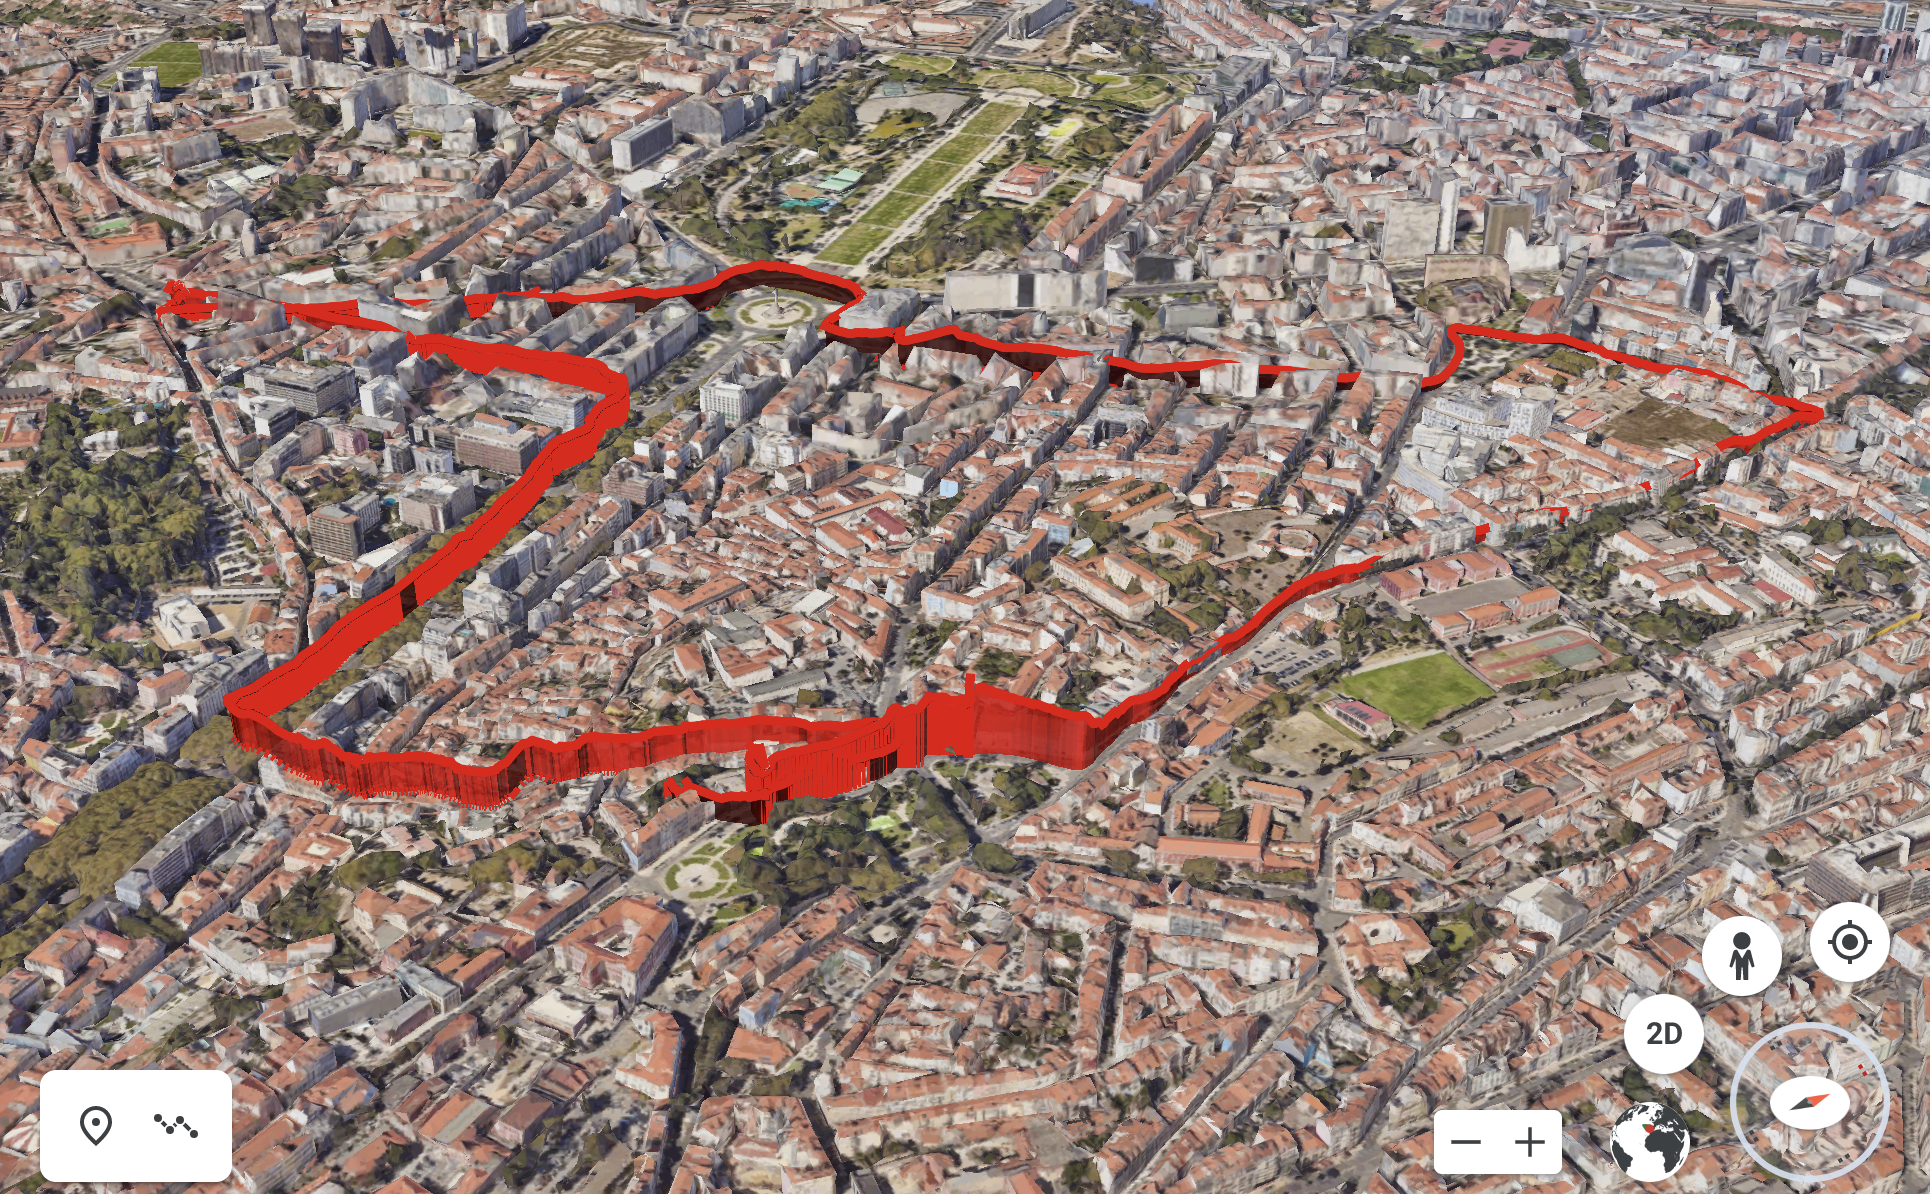
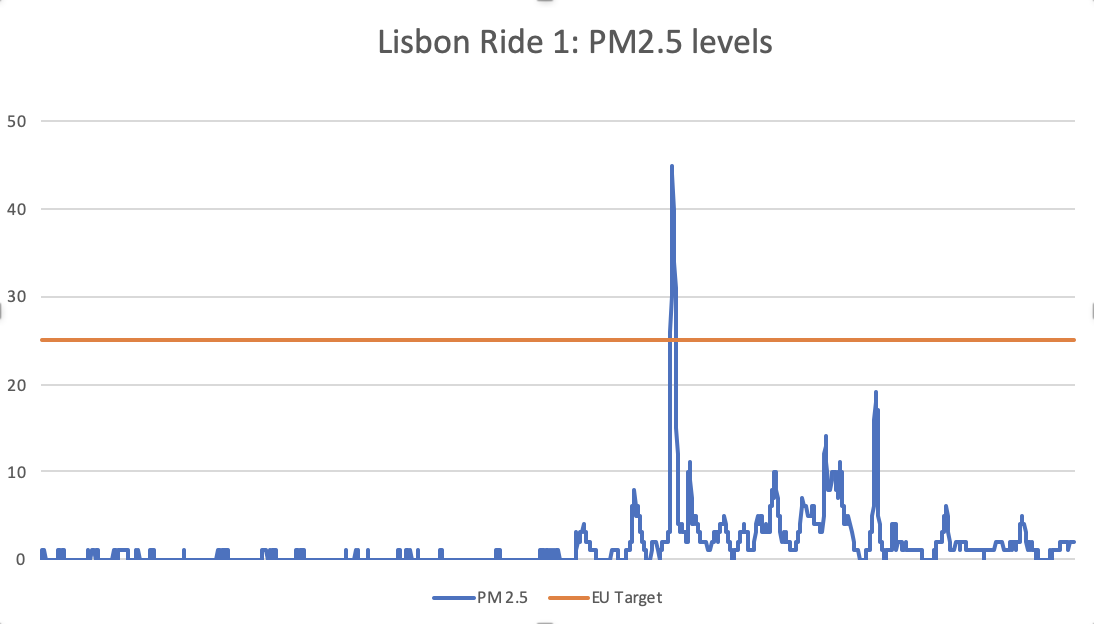
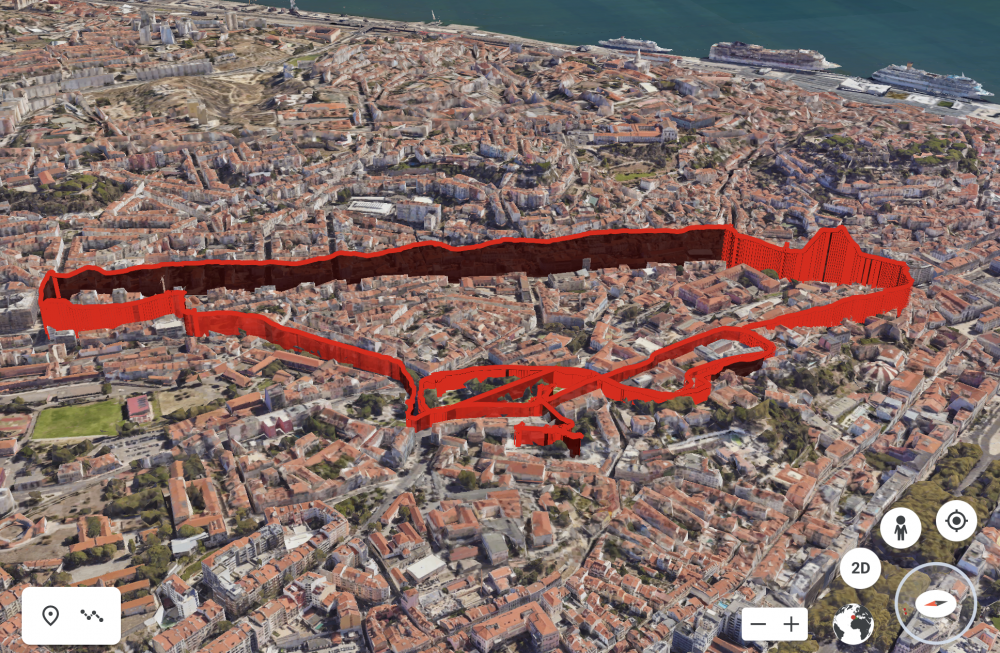
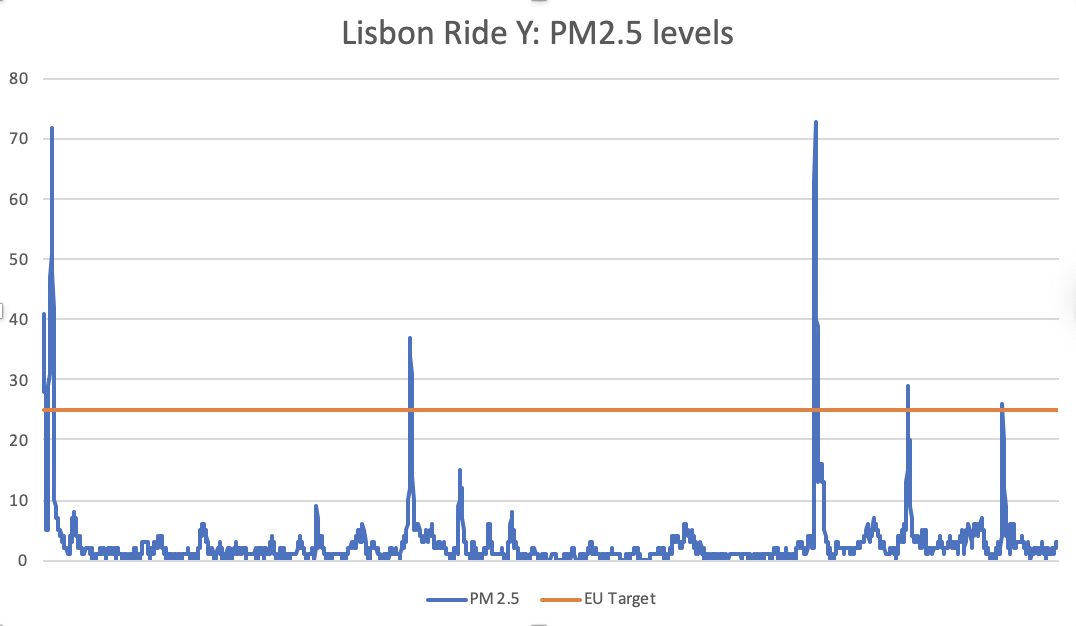
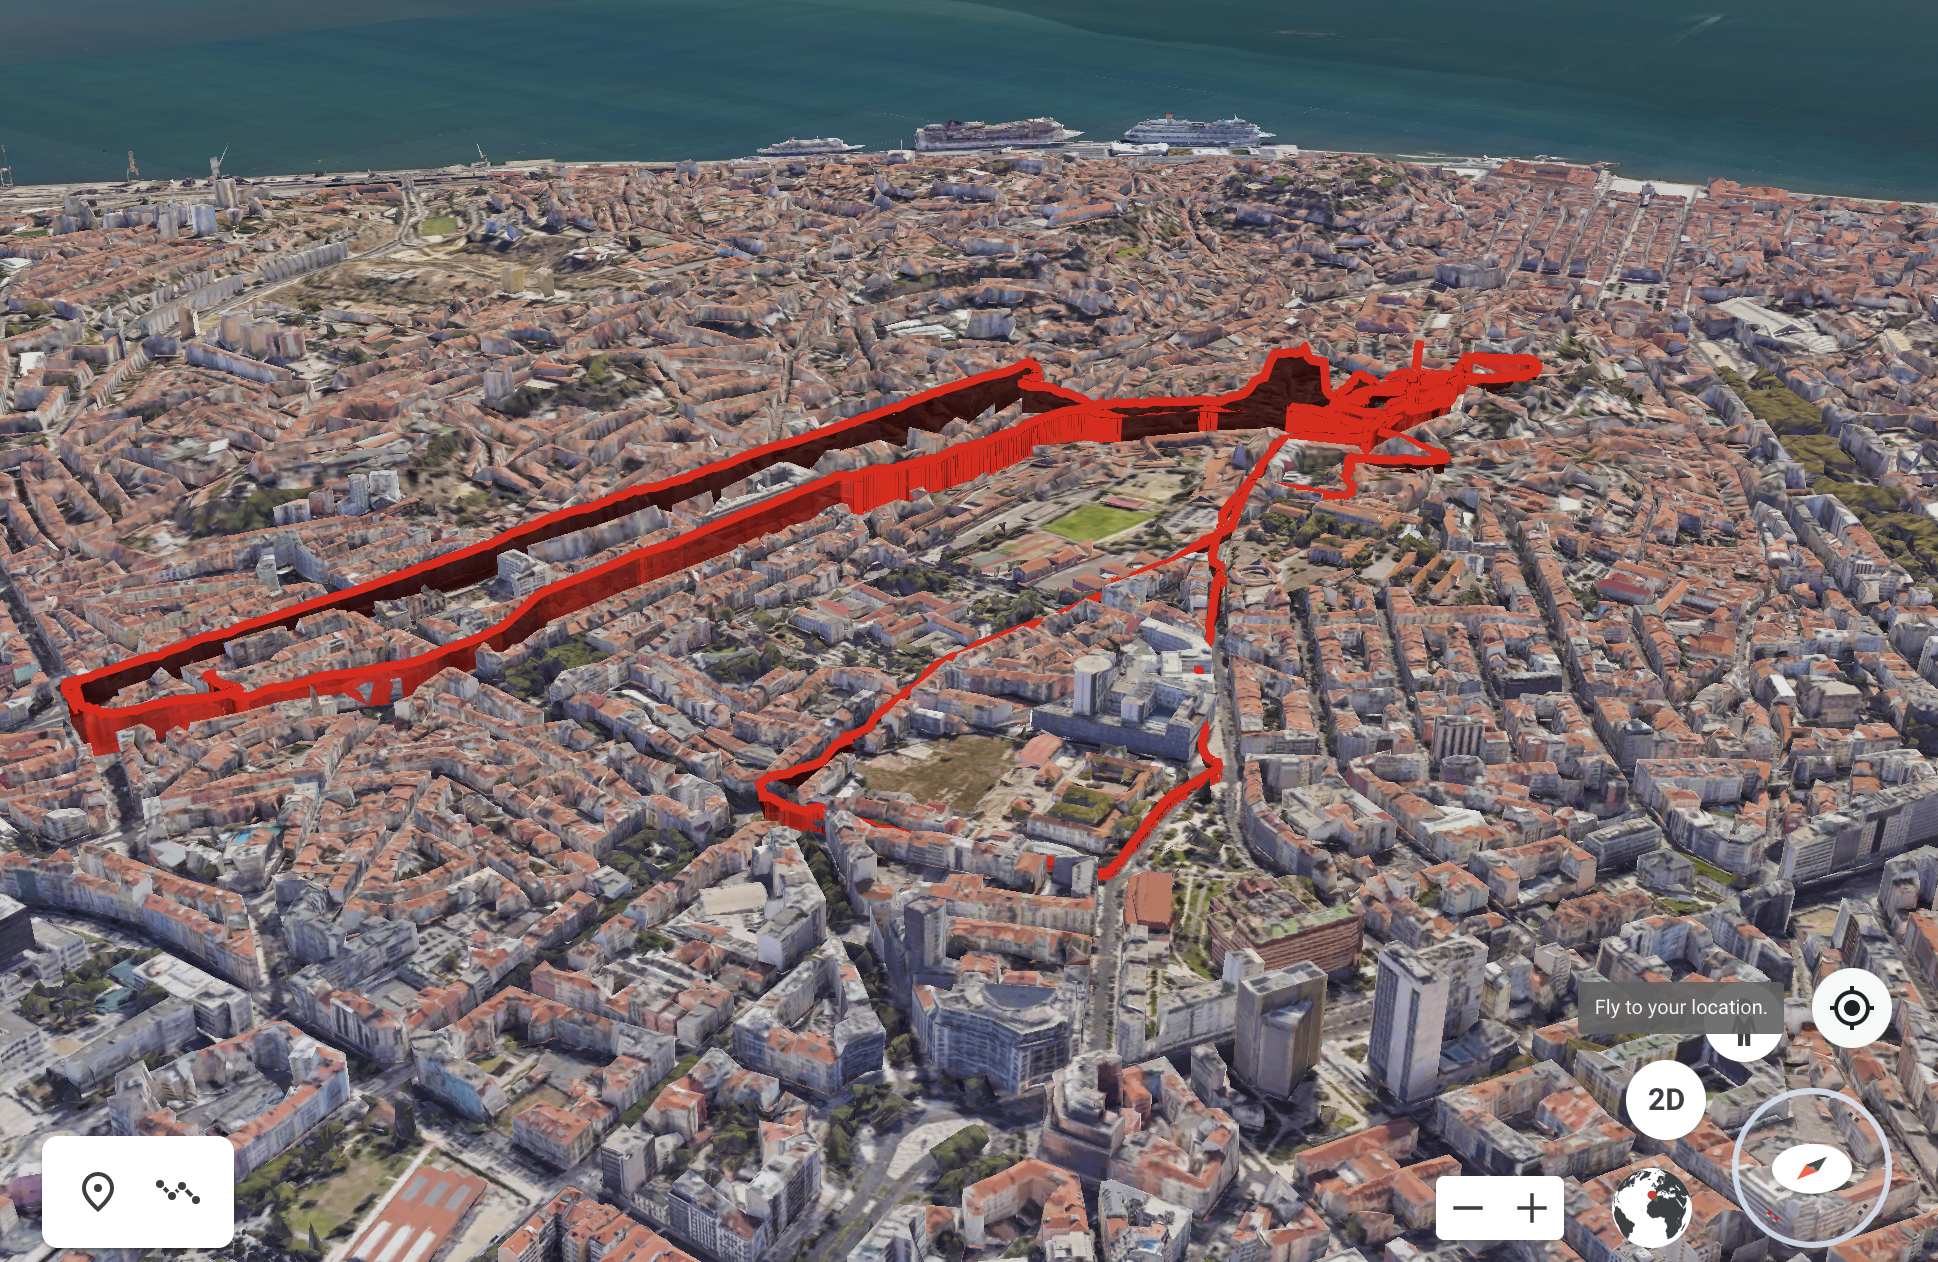
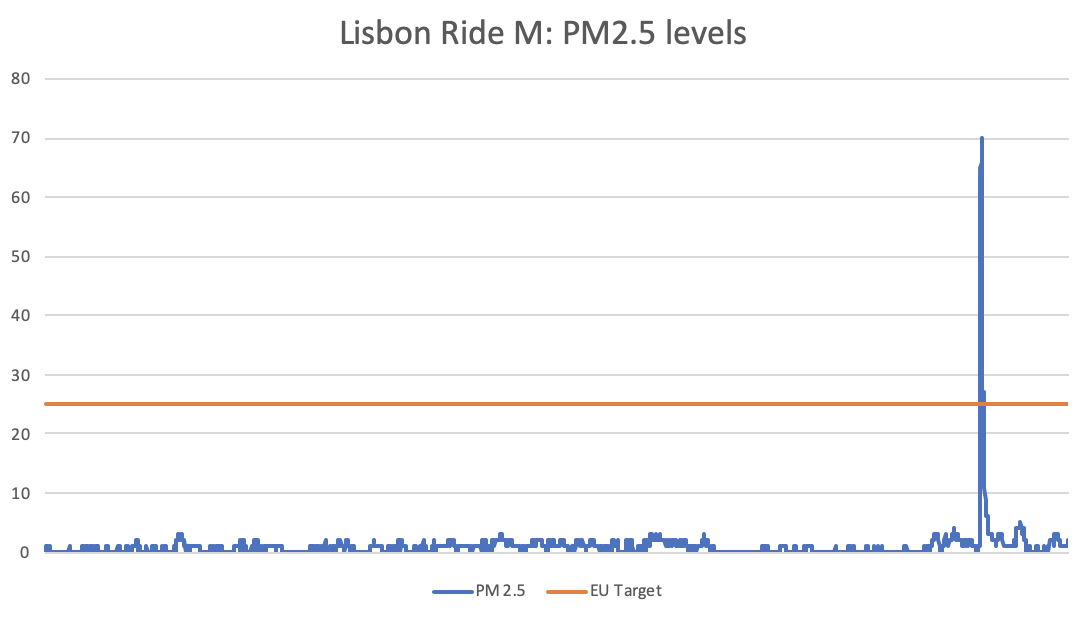
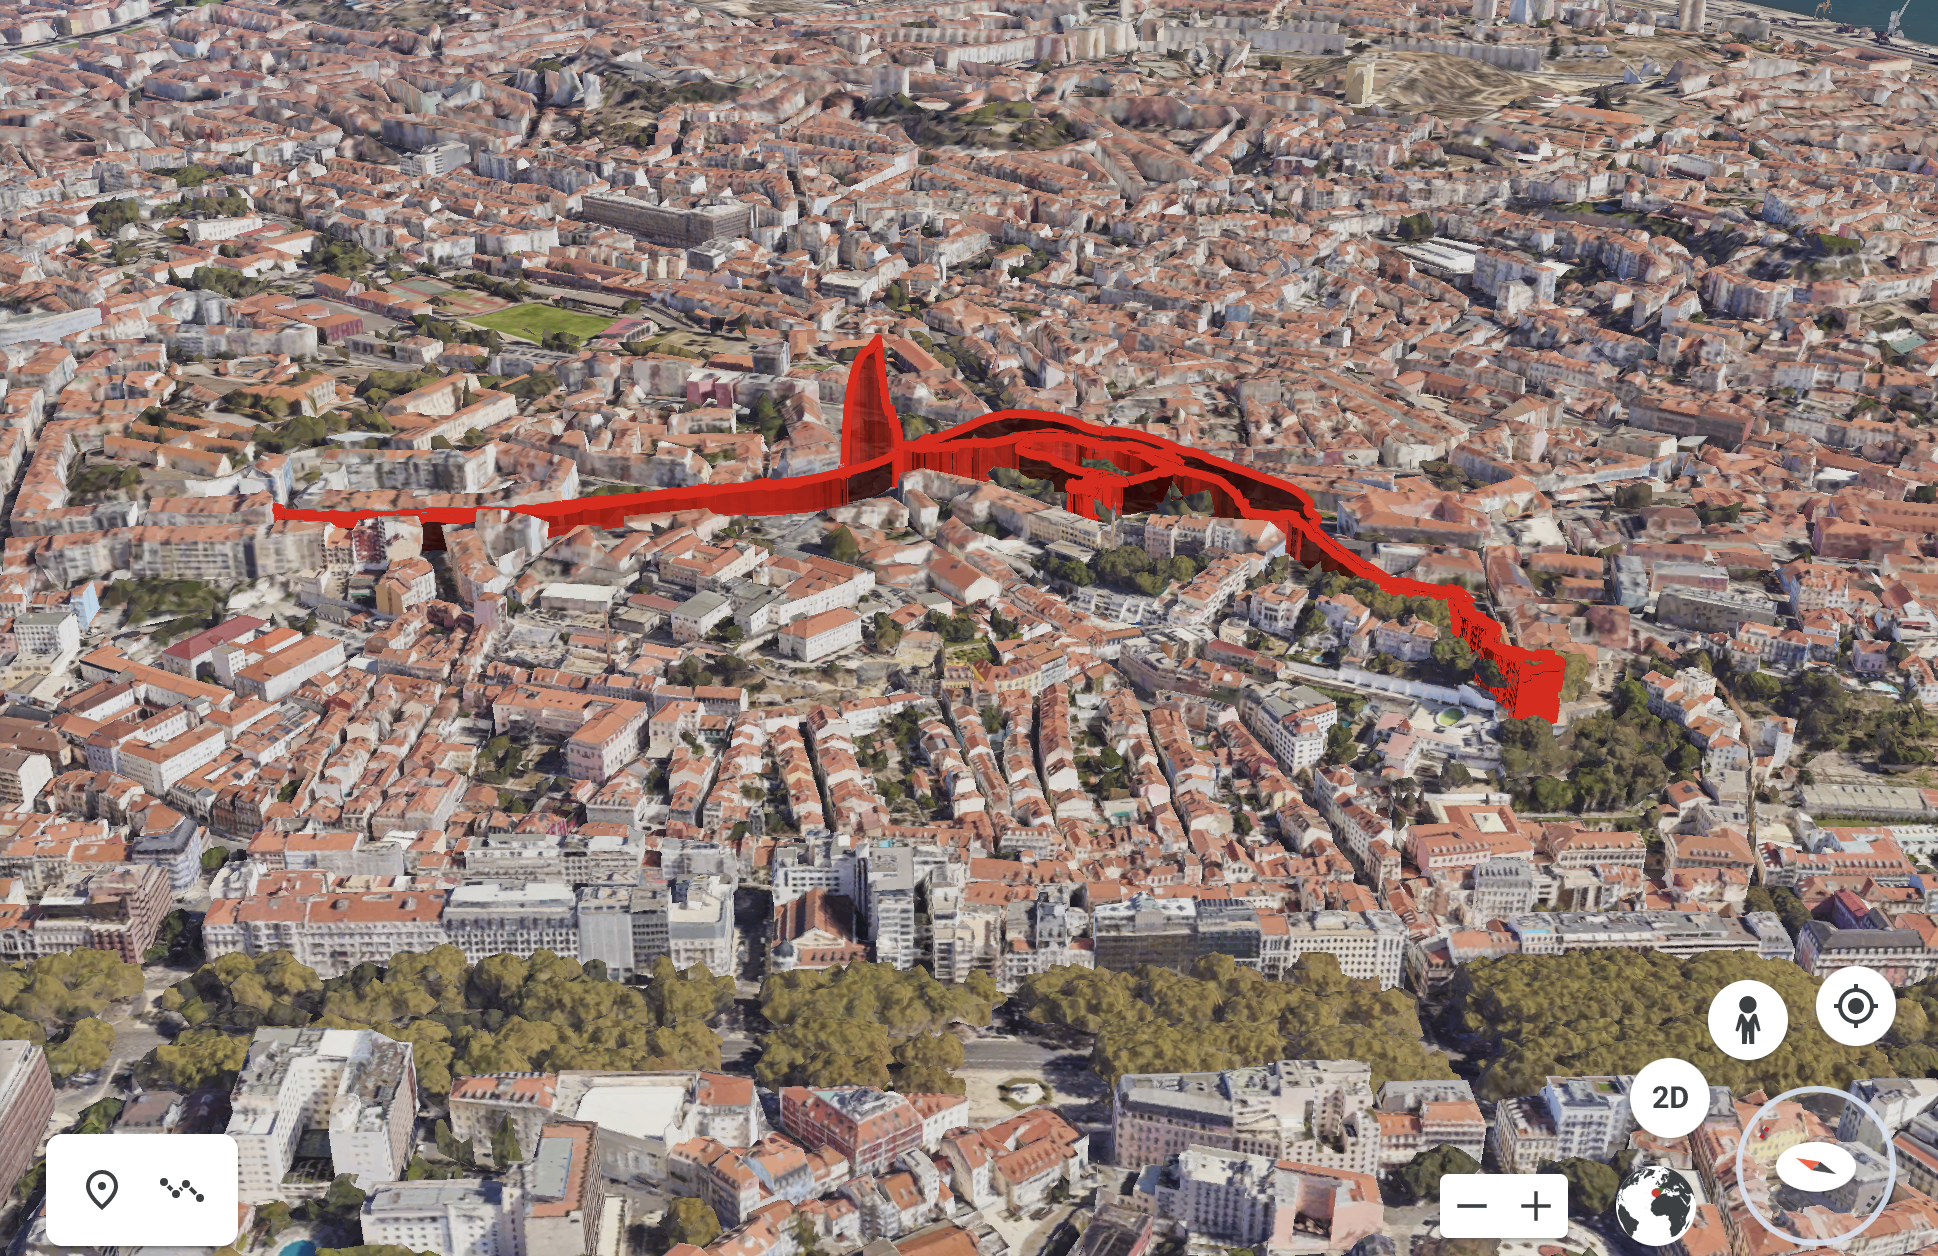
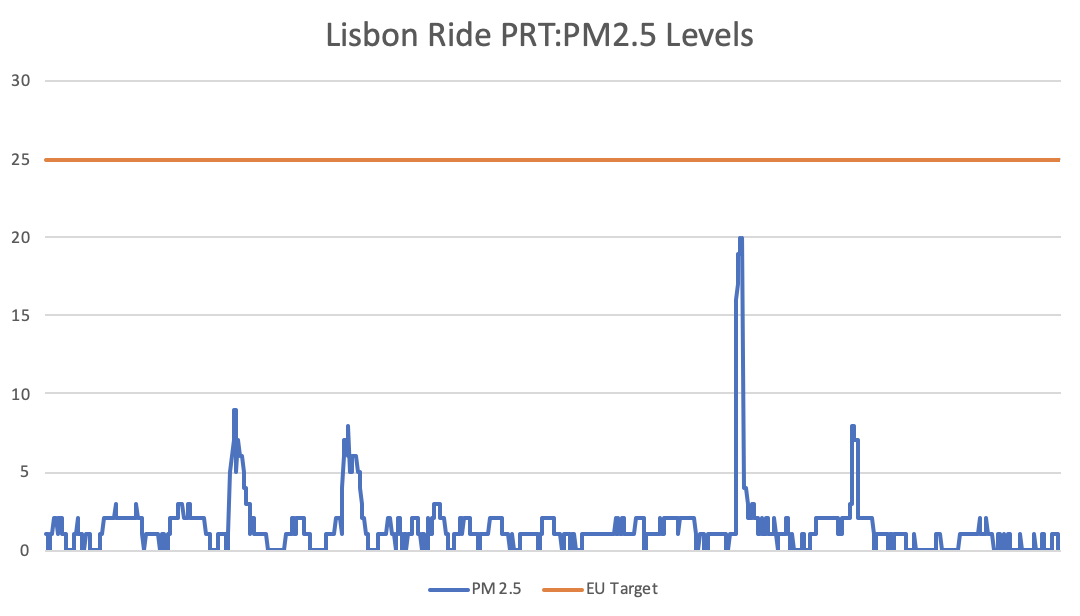
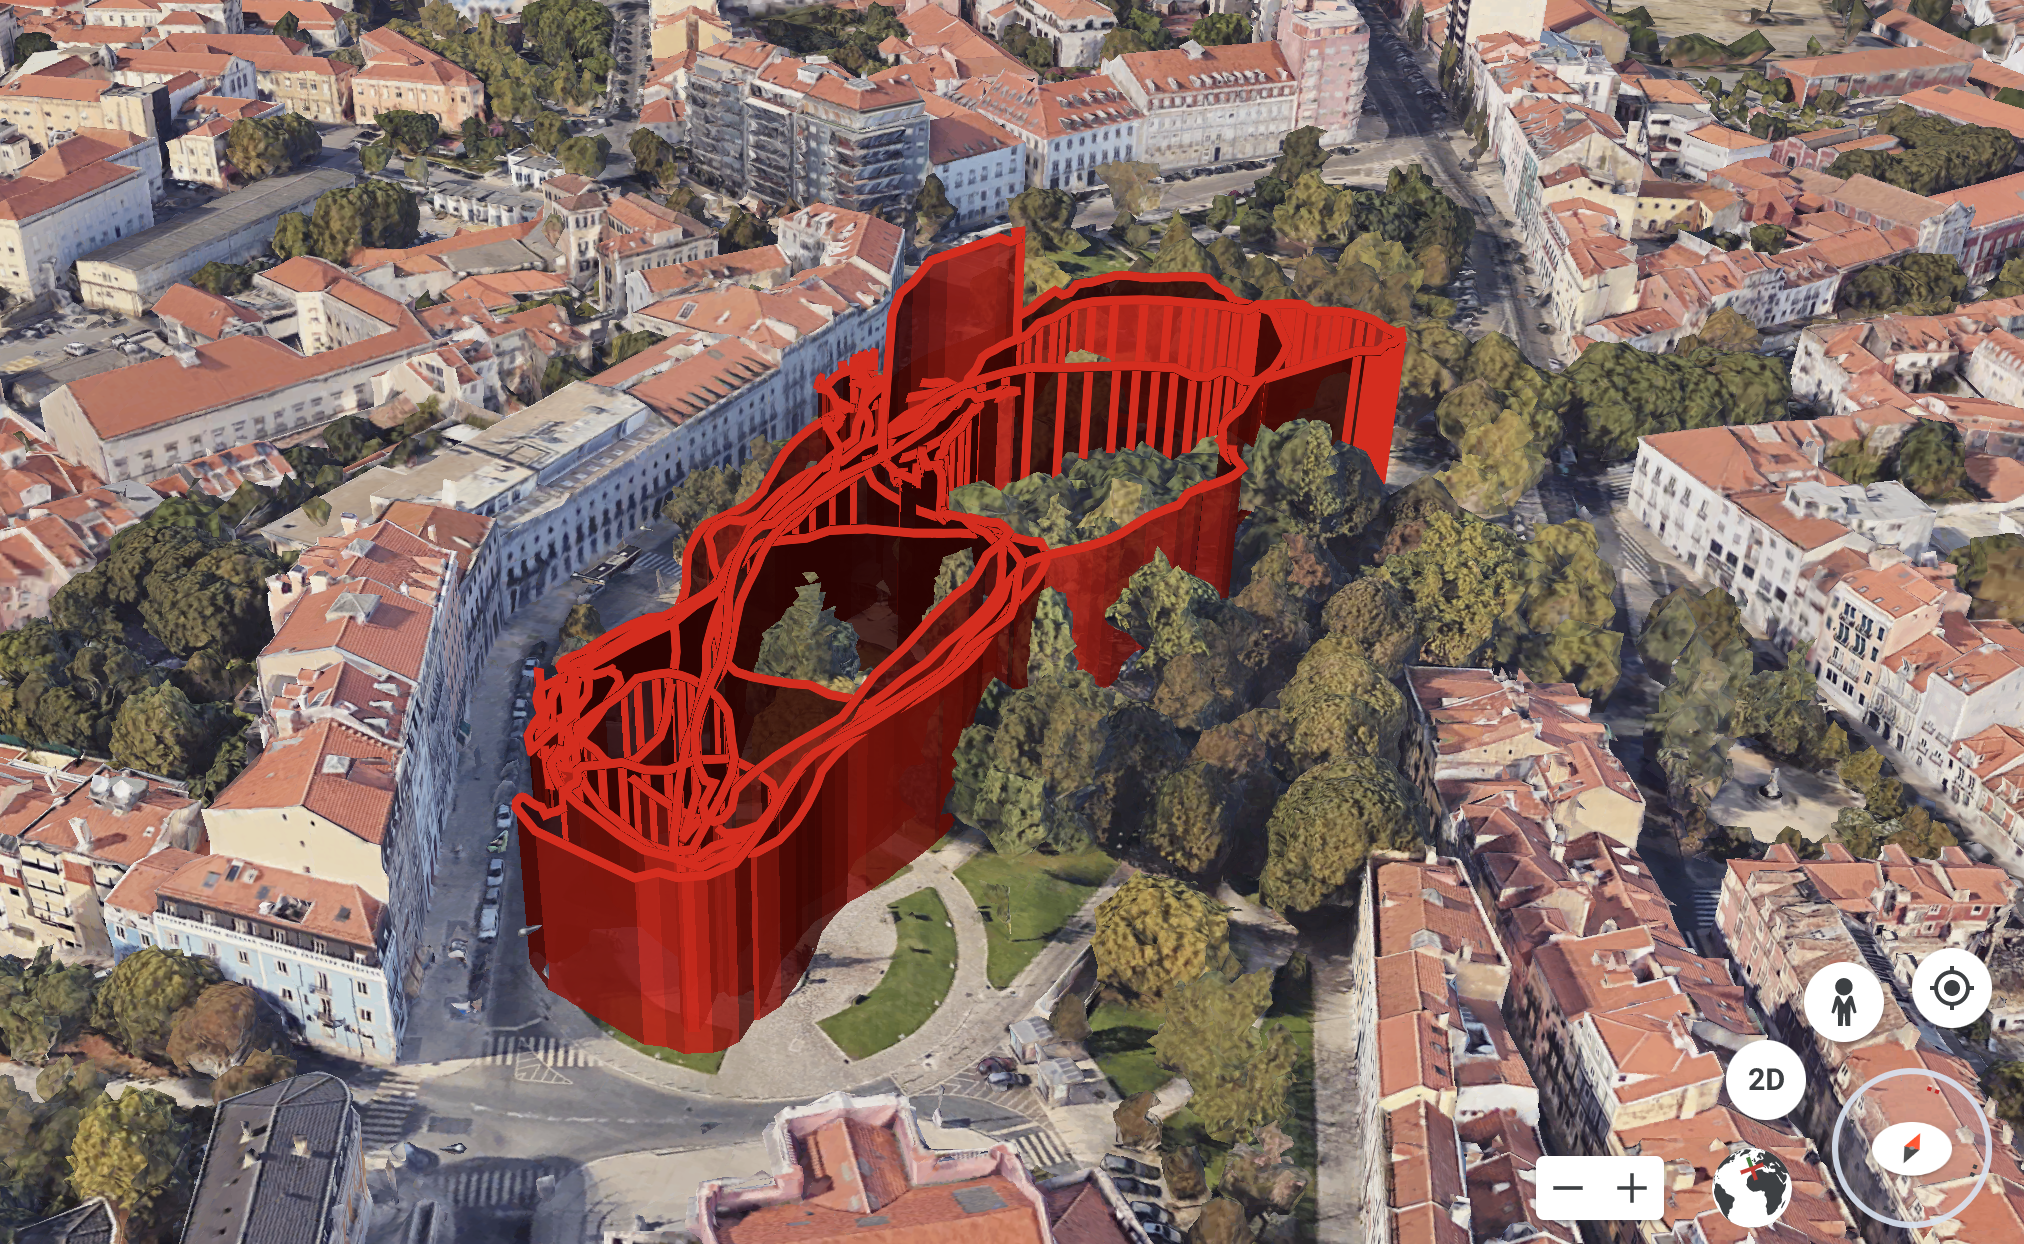
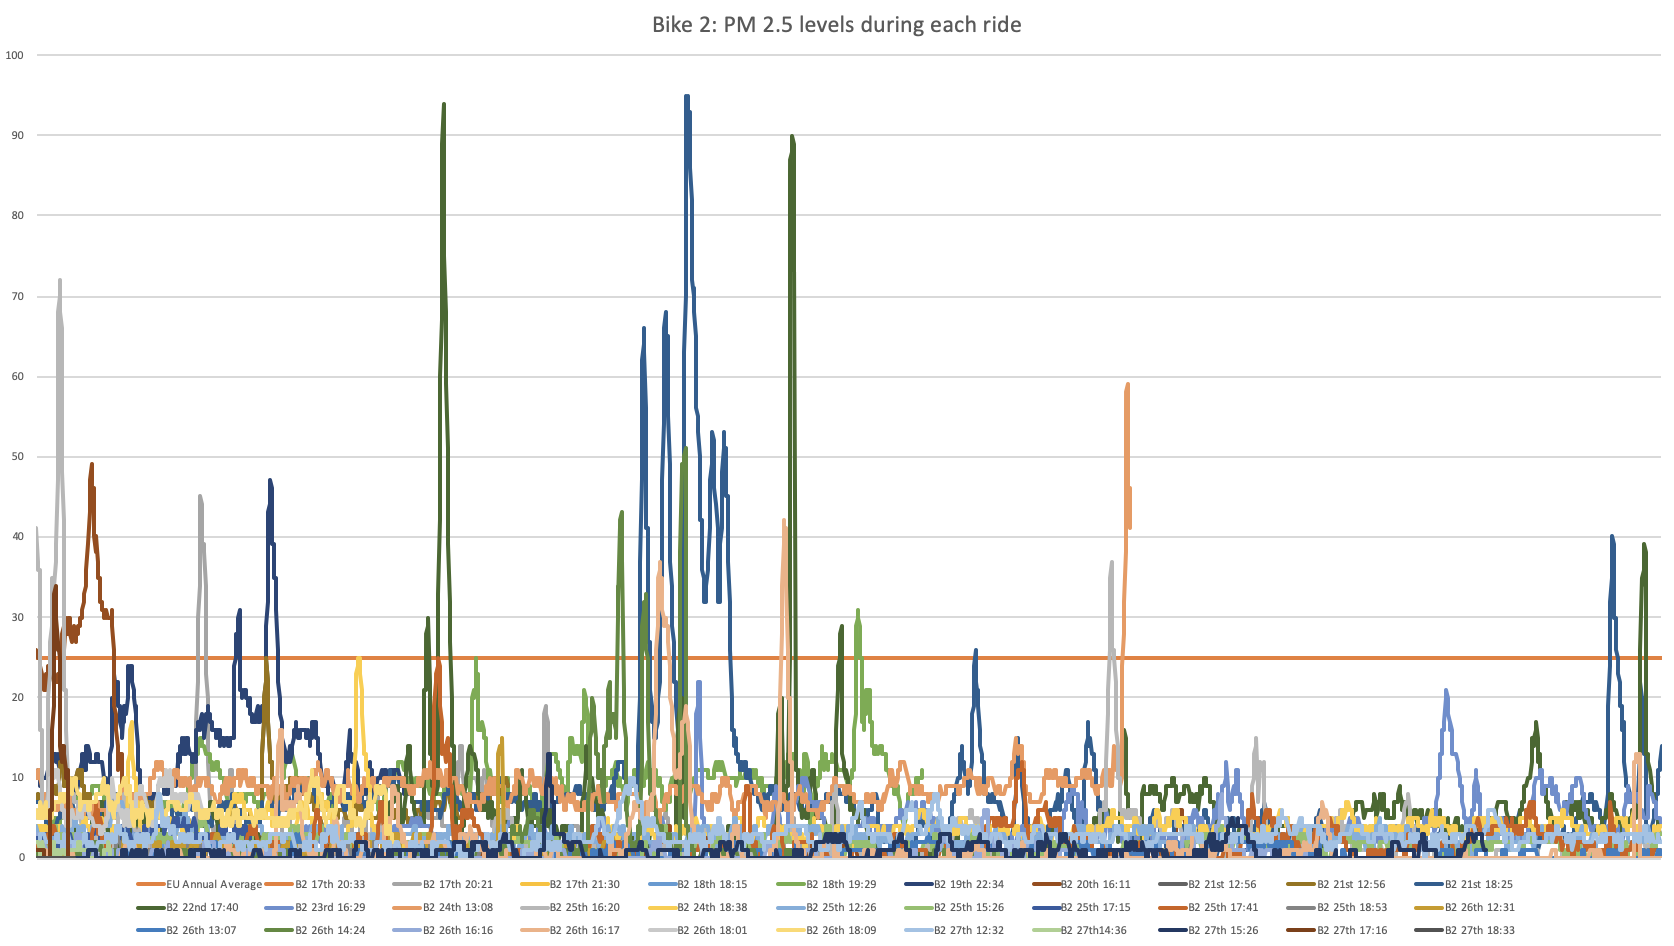
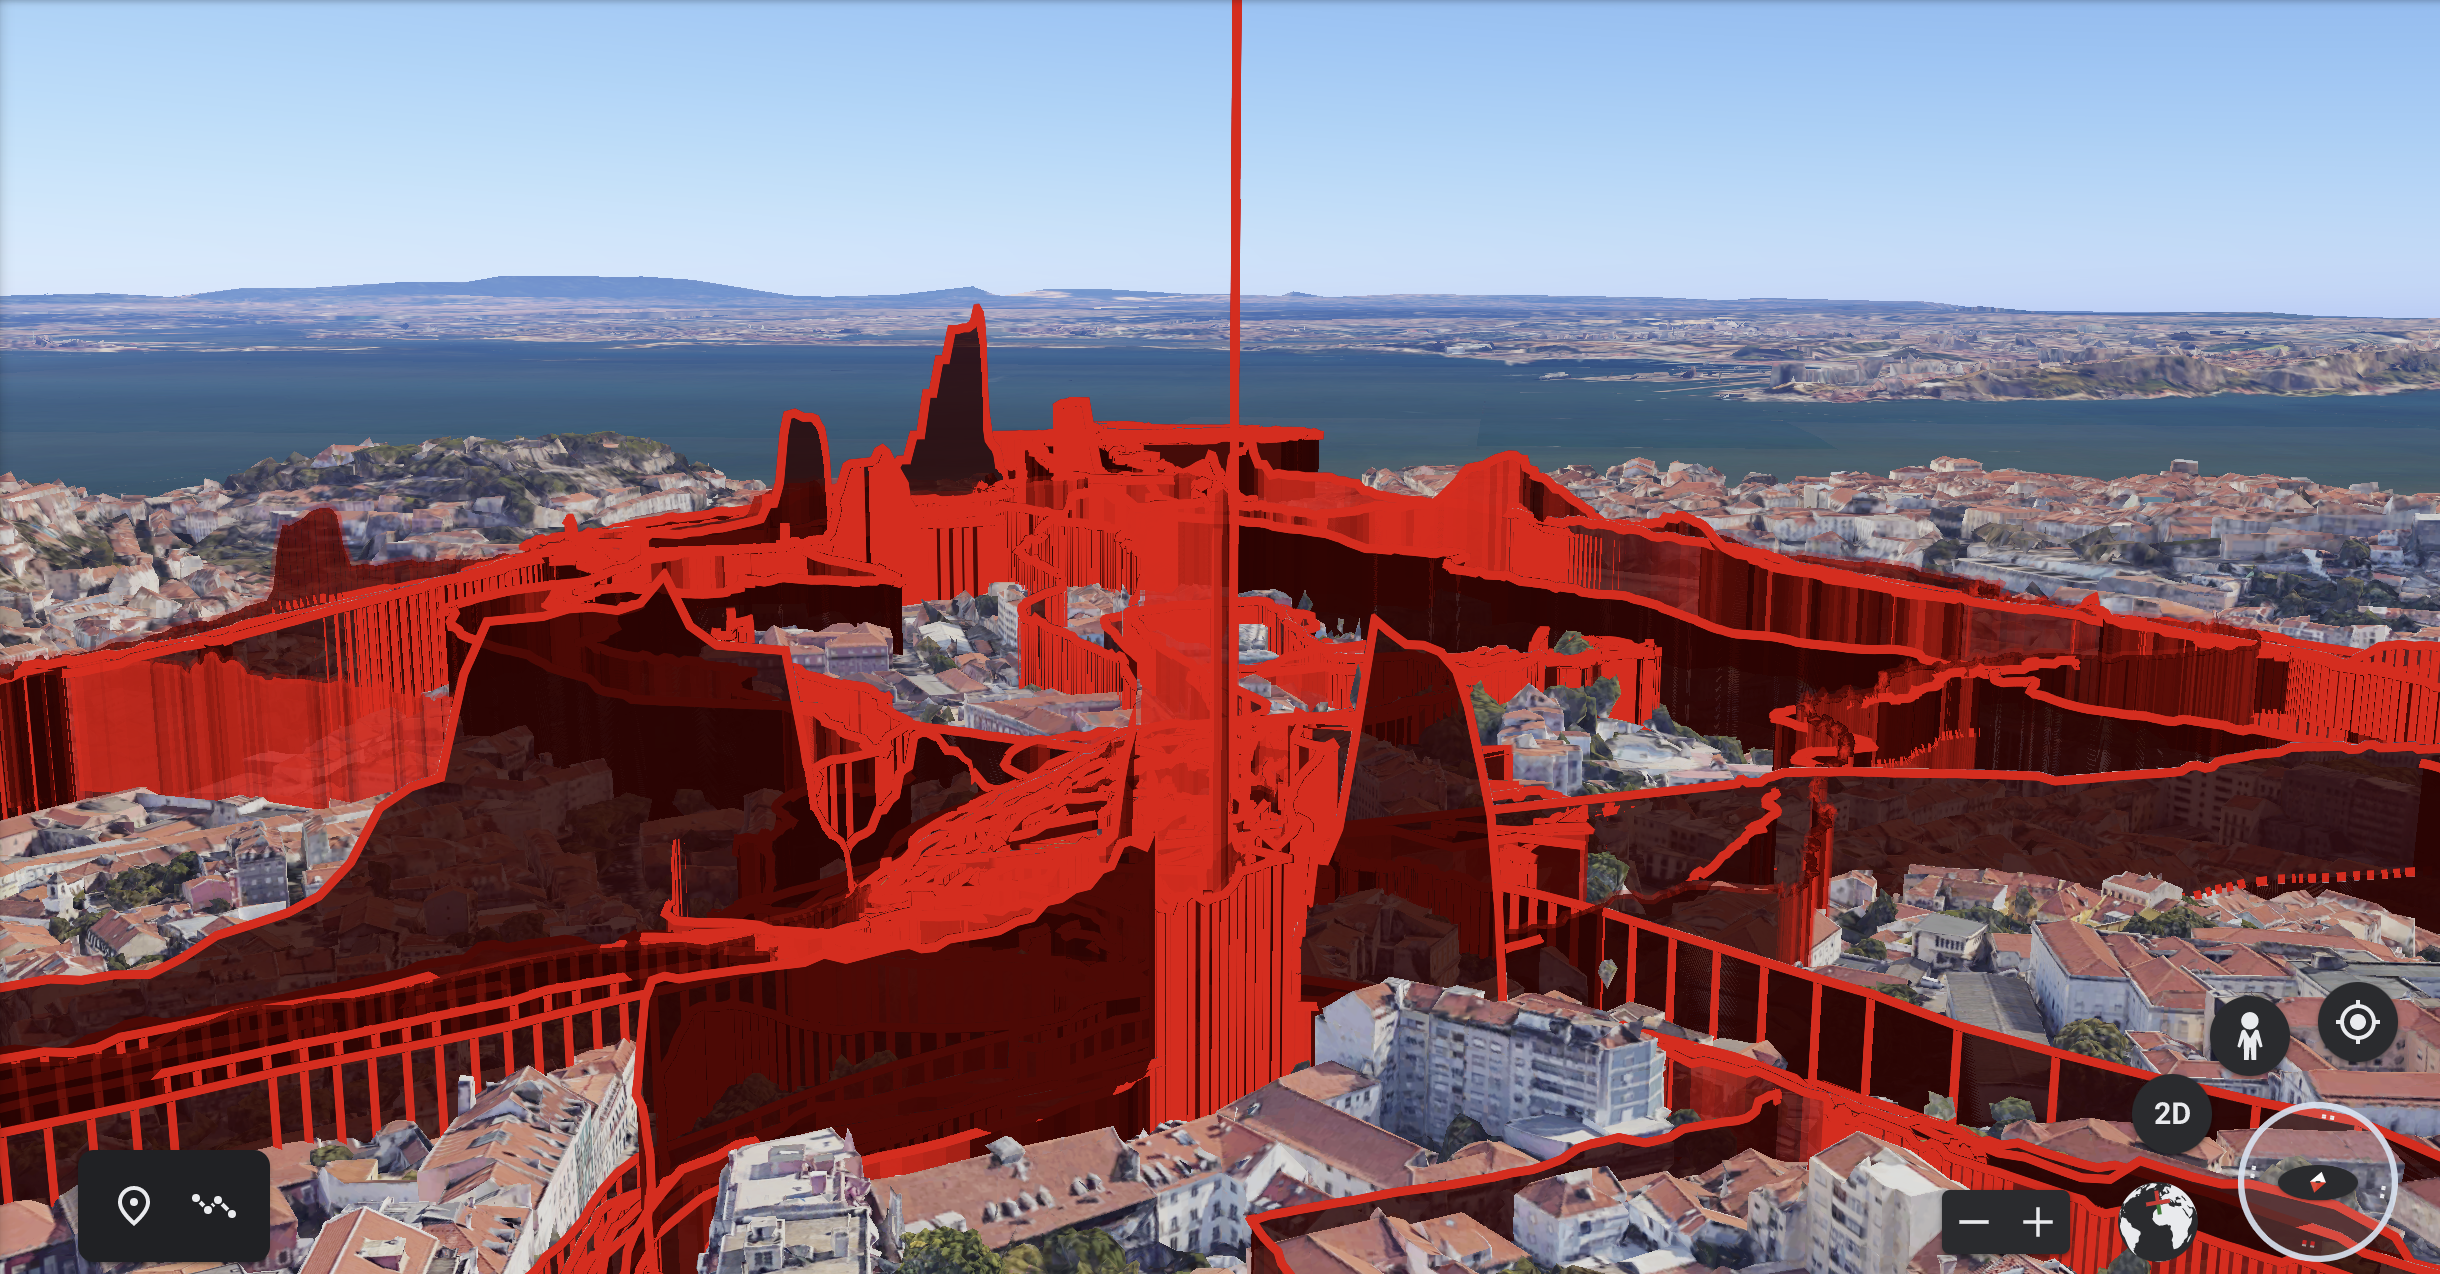
The chart of the left (below) displays all rides taken on our Bike #2 throughout the week, showing the variance of values experienced on each ride. We had 4 Enviro bikes running in Lisbon, so this represents a quarter of our data. The 3D visualisations on the right (below) captures many of the rides that we looked at with our riders.
What we found through Enviro Biking in Lisbon
We came up with many questions about air pollution and how it moves and changes, not only with location and volumes of traffic/trees/ architecture, but with the time of day and the weather in Lisbon. We also discovered much including :-
- finding certain hot spots of constantly high pollution, often around junctions (cars starting and stopping?)
- busy roads didn’t spike as much as we expected (other pollutants may have increased significantly, but PM2.5 only rose slightly)
- unknown passing sources caused hugely high dangerous spikes (maybe pavement vents from subways / certain vehicles / air extraction units)
- narrow roads with high buildings seemed to trap air and therefore PM2.5 levels rose, which was particularly unexpected as these areas were often car free and quiet
- that PM2.5 moves in gusts or bubbles , ie. it would pass over one bike and then the next, which we could all hear from our ‘sonic alarms’ for high pollution being triggered.
- parks were not always free from pollution, high levels would gust through – possibly from passing vehicles around the edge or pollen from the trees?
- pollution was higher at night, often near busy restaurants frying fish on charcoal/bars full of happy smokers/ a specific Hotel on a major inner highway – their extractor fans perhaps ?
- completely unknown sources triggered high levels of pollution that we just couldn’t match to anything in our surroundings. Was it simply moving in the air? Or are there causes that we have no idea about?!
There is also much more to investigate through study of the data. One finding is apparent from our readings so far – that averaging air pollution data loses these significant peaks of pollution. The figures for peaks also really need to be included in data reporting from official monitoring stations to understand the full range of what is in the air.
The Environmental bikes are offering a unique method of air pollution investigation. Riders found the experience to be exhilarating and empowering – to be able to understand the quality of the air they were riding through inspired a very different way of riding and listening. No longer were they simply floating through space listening, but were out seeking air pollution by what they heard and truly engaging with the air space and city around them therefore in a new way.
Data download and notes
Download: lisbon-air-pollution-data [23mb]
Notes: Our sonifications at the Enviro Bike launch Lisbon used 3 data readings, 0.3+, 0.5+ and PM2.5 (>2.5), plus our Gas sensors. Our visualisations depict the PM2.5 levels only.
These numbers refer to the particle size and count range of greater than or less than. 0.3+ and 0.5+ measures capture both the pollutants and organic matter like pollen. PM2.5 measures only the super fine particles that gets into our lungs and bloodstream..
The gas sensors differed on each bike and we do not have a log of this to cross reference against the data.
The ‘EU Target’ shown above is an annual average, while our PM2.5 data shows actual, not averaged figures.

