Air Pollution in Middlesbrough
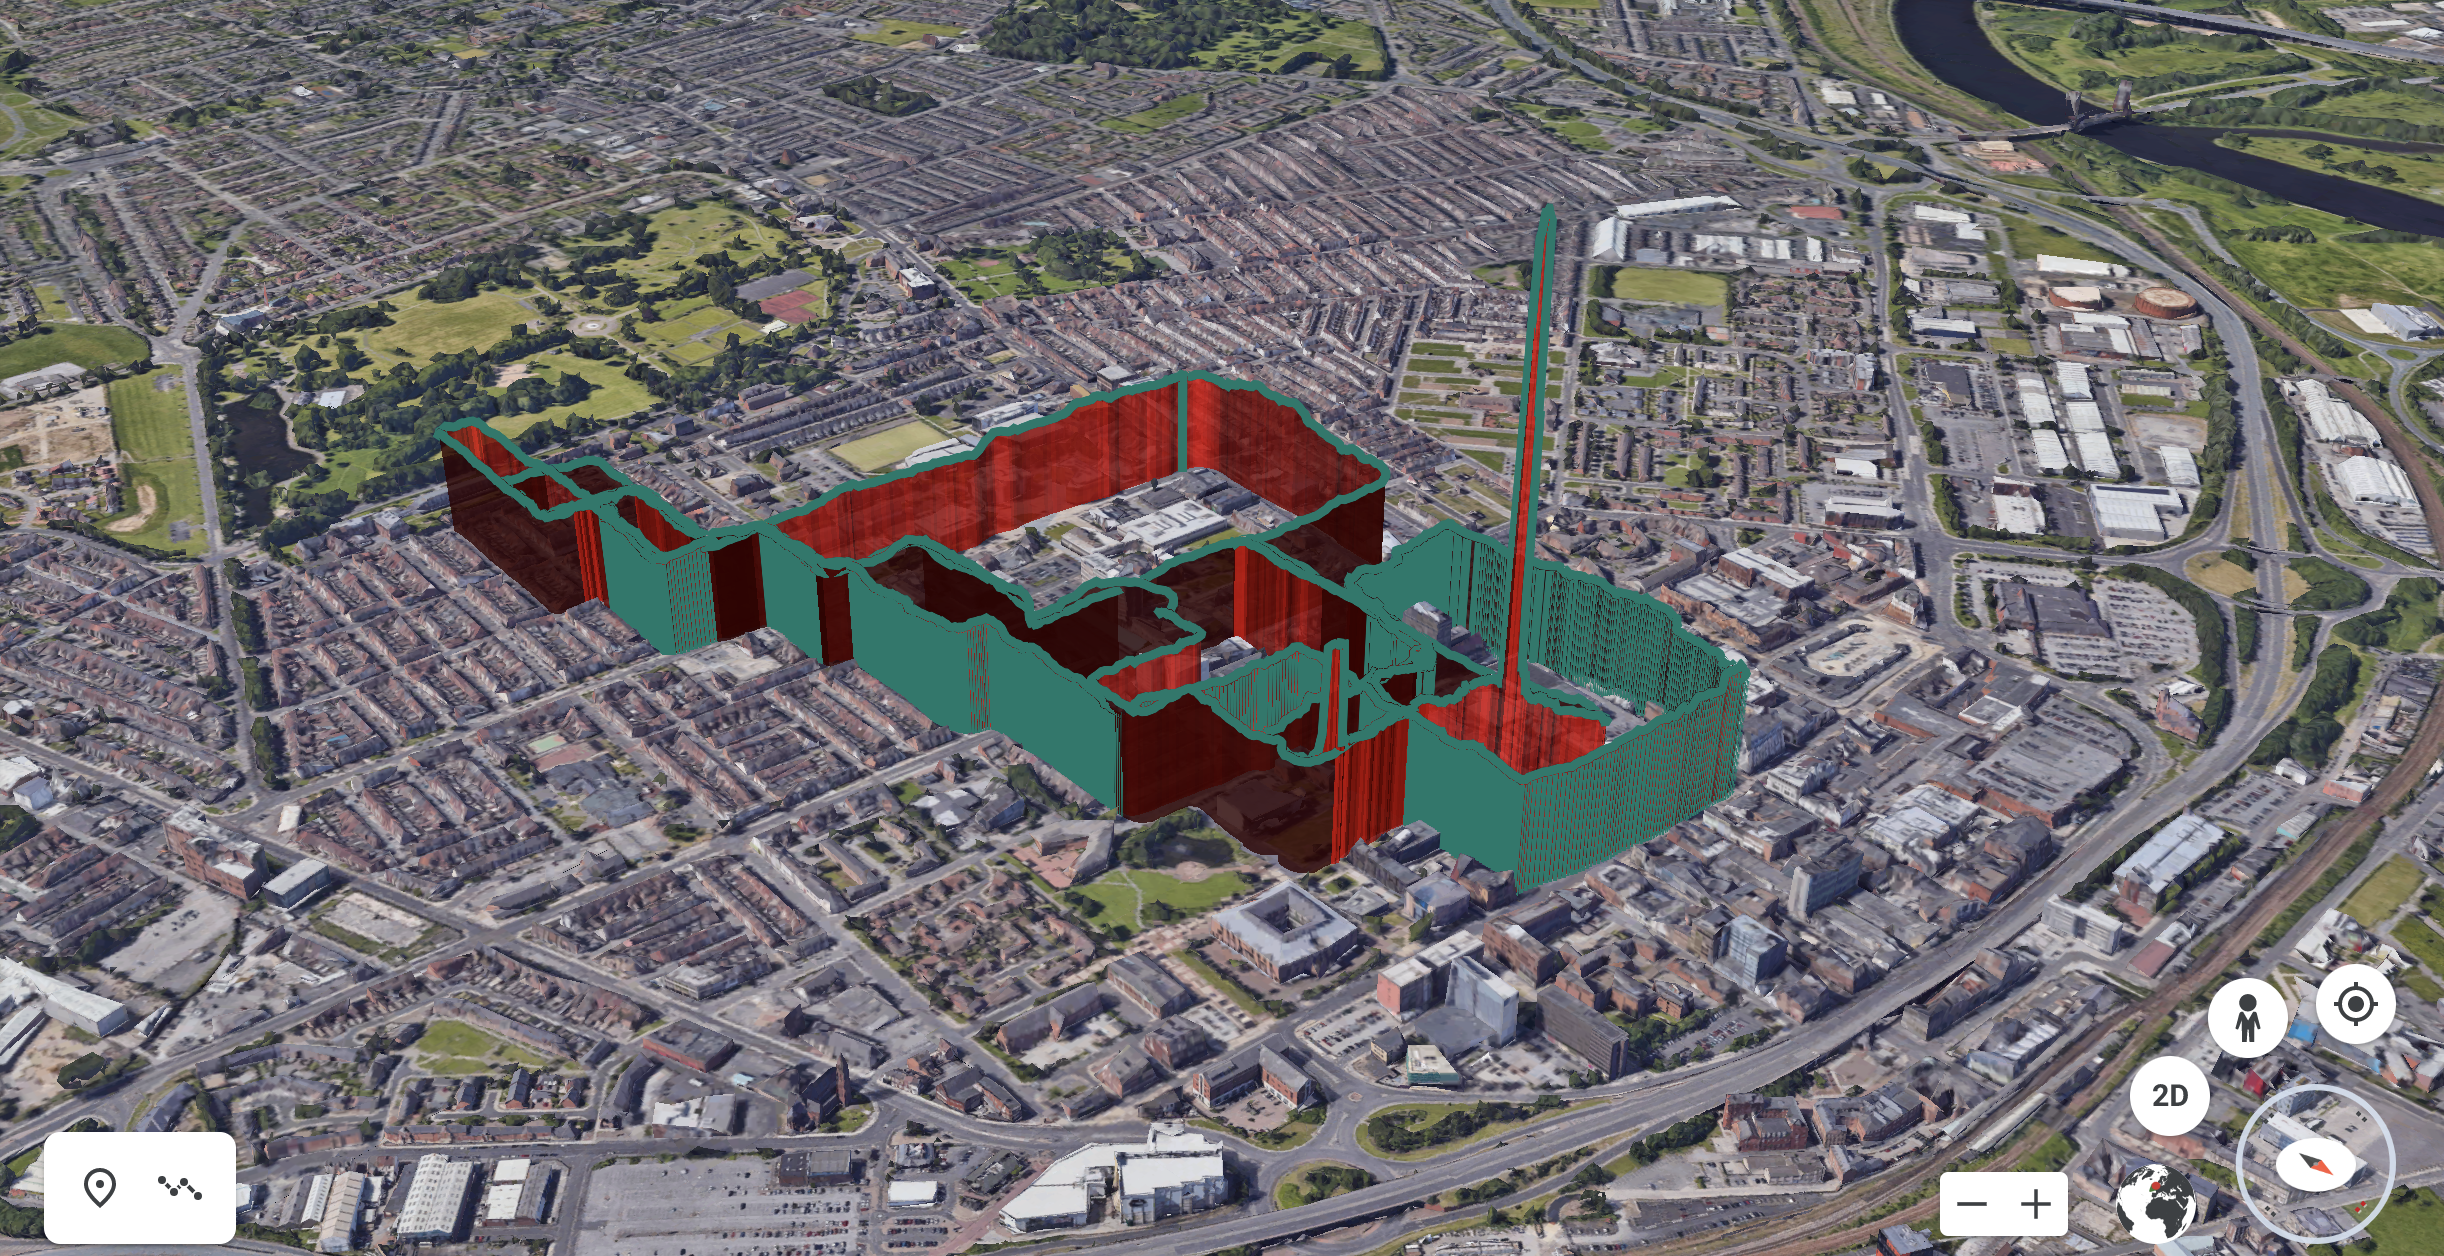
Air pollution data captured on Enviro Bikes during Sonic Arts Week (July 2021), Middlesbrough, playing the composition ‘no scent or colour‘. Riders explore the town along any street, path or park they chose, hearing the sonification of the pollution live while they ride.
*We’re updating this page throughout the festival with charts and 3D maps and all data for free download. Also follow us on twitter and insta for daily updates*
What we’re finding through Enviro Biking in Middlesbrough
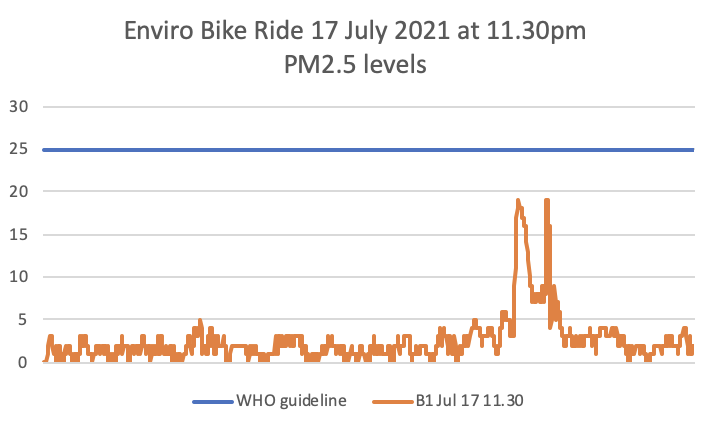
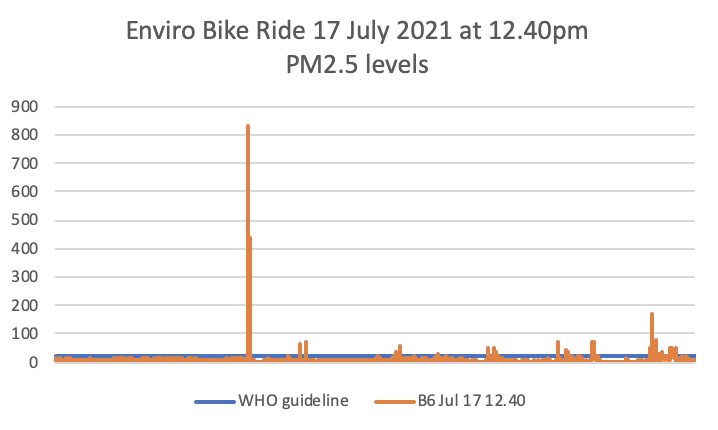
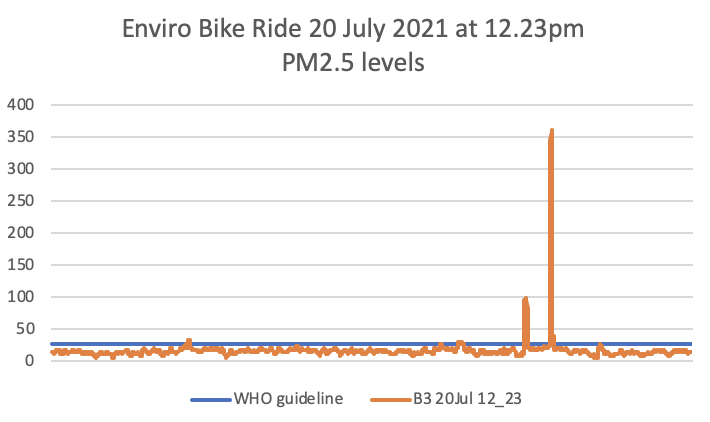
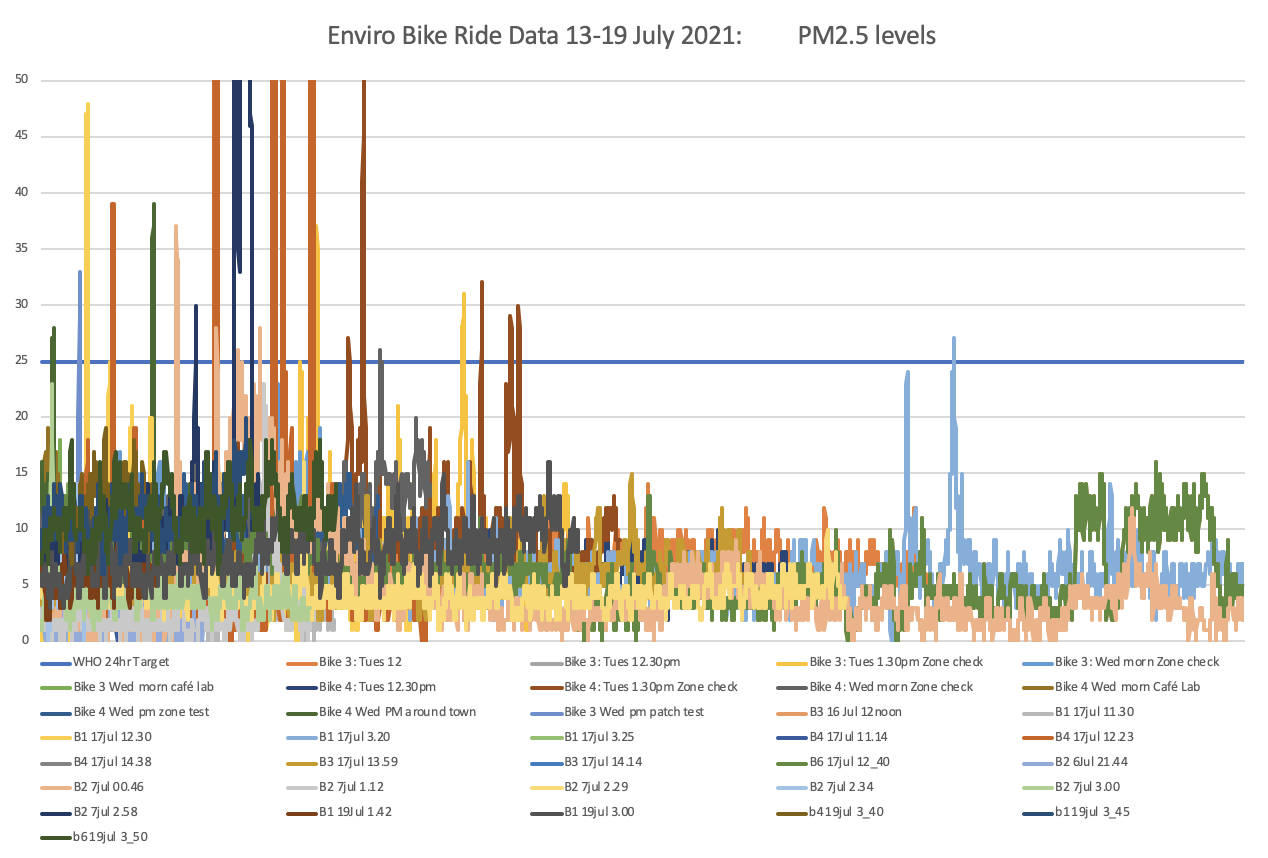
Middlesbrough’s air has mainly been quite clean with PM2.5 levels below 15, often below 10 and on good days below 5. Occasional peaks are heard when riding past restaurants, bars, cars , smokers and vapers. But huge spikes of PM2.5 punctuate this relatively clean air, appearing in short bursts, reaching levels we’ve never recorded before ranging from 600-3000 in concentration. We don’t know what this is.
On Tuesday the clean air suddenly rose to higher levels of PM2.5, seemingly all across the town. Our Enviro Bikes were playing their ‘big rain’ file almost continuously (this is triggered over 17) and our ‘disaster’ flooded sounds fairly regularly (triggered over 25). We’re currently looking into the levels today, Wednesday & Thursday, and cross comparing against the government monitoring station. We’ll share more soon.
We’re learning that Vape smoke is hugely high in PM 2.5 concentration, with values hitting 3000 we believe. The festival team have been doing vape blowing tests on the sensors, exploring the PM content before inhale and after… We’re going to share some data on this soon. Our sensors are sensitive to humidity however, so this will be increasing the data….
During the development of this project we researched a number of aspects of air pollution, including; how the weather affects air pollution (particulate matter, PM2.5 and PM10 specifically), how we can sense pollution, and what the sources of it are. All of this had fed into the sonic composition of ‘no scent or colour’, but is also relevant information about the condition of air pollution. This includes:
Humidity (or dampness) which increases PM2.5 and PM10 levels. (reference 1) We’ve heard increases when riding on humid days. As mentioned, our sensors are sensitive to humidity though.
Large rain falls can reduce PM levels (reference 2). We like to think of this as almost washing away the particulate matter from the air. We included this in the composition – rain falls with higher pollution levels.
Wind seems to blows the PM away, dispersing its concentration perhaps. We think that high wind levels often correlate with low PM levels that we gather.
Low thick cloud can increase pollution by trapping it in (reference 3), however we’ve not heard this from our rides. We’re going to look further into this.
PM2.5 is completely undetectable to human senses (reference 3 & 4), yet PM10 can sometimes be visible as coloured air (for example black if made from carbon). This is a key inspiration for the sound work the bikes play.
1/3 of particulate matter in the UK’s air comes from other countries (reference 5). Yet it is also very localized – walking close to the road (or riding behind a car’s exhaust presumably) gives a much higher exposure than walking on the far side of the pavement away from the cars. (reference 3).
More thoughts coming soon …
– –
reference 1 & 2: https://www.hindawi.com/journals/amete/2020/5039613/
reference 3 & 6: Clearing the Air, Tim Smedley. https://www.amazon.co.uk/Clearing-Air-Beginning-End-Pollution/dp/B08CB2ZFNF/ref=tmm_aud_swatch_0?_encoding=UTF8&qid=&sr=
Reference 4: Dr Katherine Thompson at Science Saturday online talk ‘Coughing up a lung, pollutants in our air’, May 15 2021 https://www.bbk.ac.uk/annual-events/science-week/science-saturdays-2021
Data download and notes
Download:
- airlog_160721_220352
- airlog_170721_132317
- airlog_170721_142400
- airlog_170721_172032
- airlog_160721_212032
- airlog_170721_131422
- airlog_170721_142339
- airlog_170721_163838
- airlog_060721_222913
- airlog_060721_223611
- airlog_060721_223648
- airlog_060721_224027
- airlog_070721_023544
- airlog_070721_030234
- airlog_070721_030336
- airlog_070721_031714
- airlog_070721_033512
- airlog_070721_033608
- airlog_070721_040651
- airlog_070721_040708
- airlog_070721_043755
- airlog_070721_045836
- airlog_070721_050607
- More coming soon
Notes:
The data sheets above contain the following data: Column A: Date & Time (this is sometimes incorrect, if the date is not during the festival dates it is an error) Column B: Latitude. Column C: longitude. Column D: n/a.Column E: direction. Column F: n/a. Column G: PM1. Column H: PM2.5 Column I: PM10 Column J: 0.3um+ Column K: 0.5um+Column L: 1um+Column M – Z: n/a
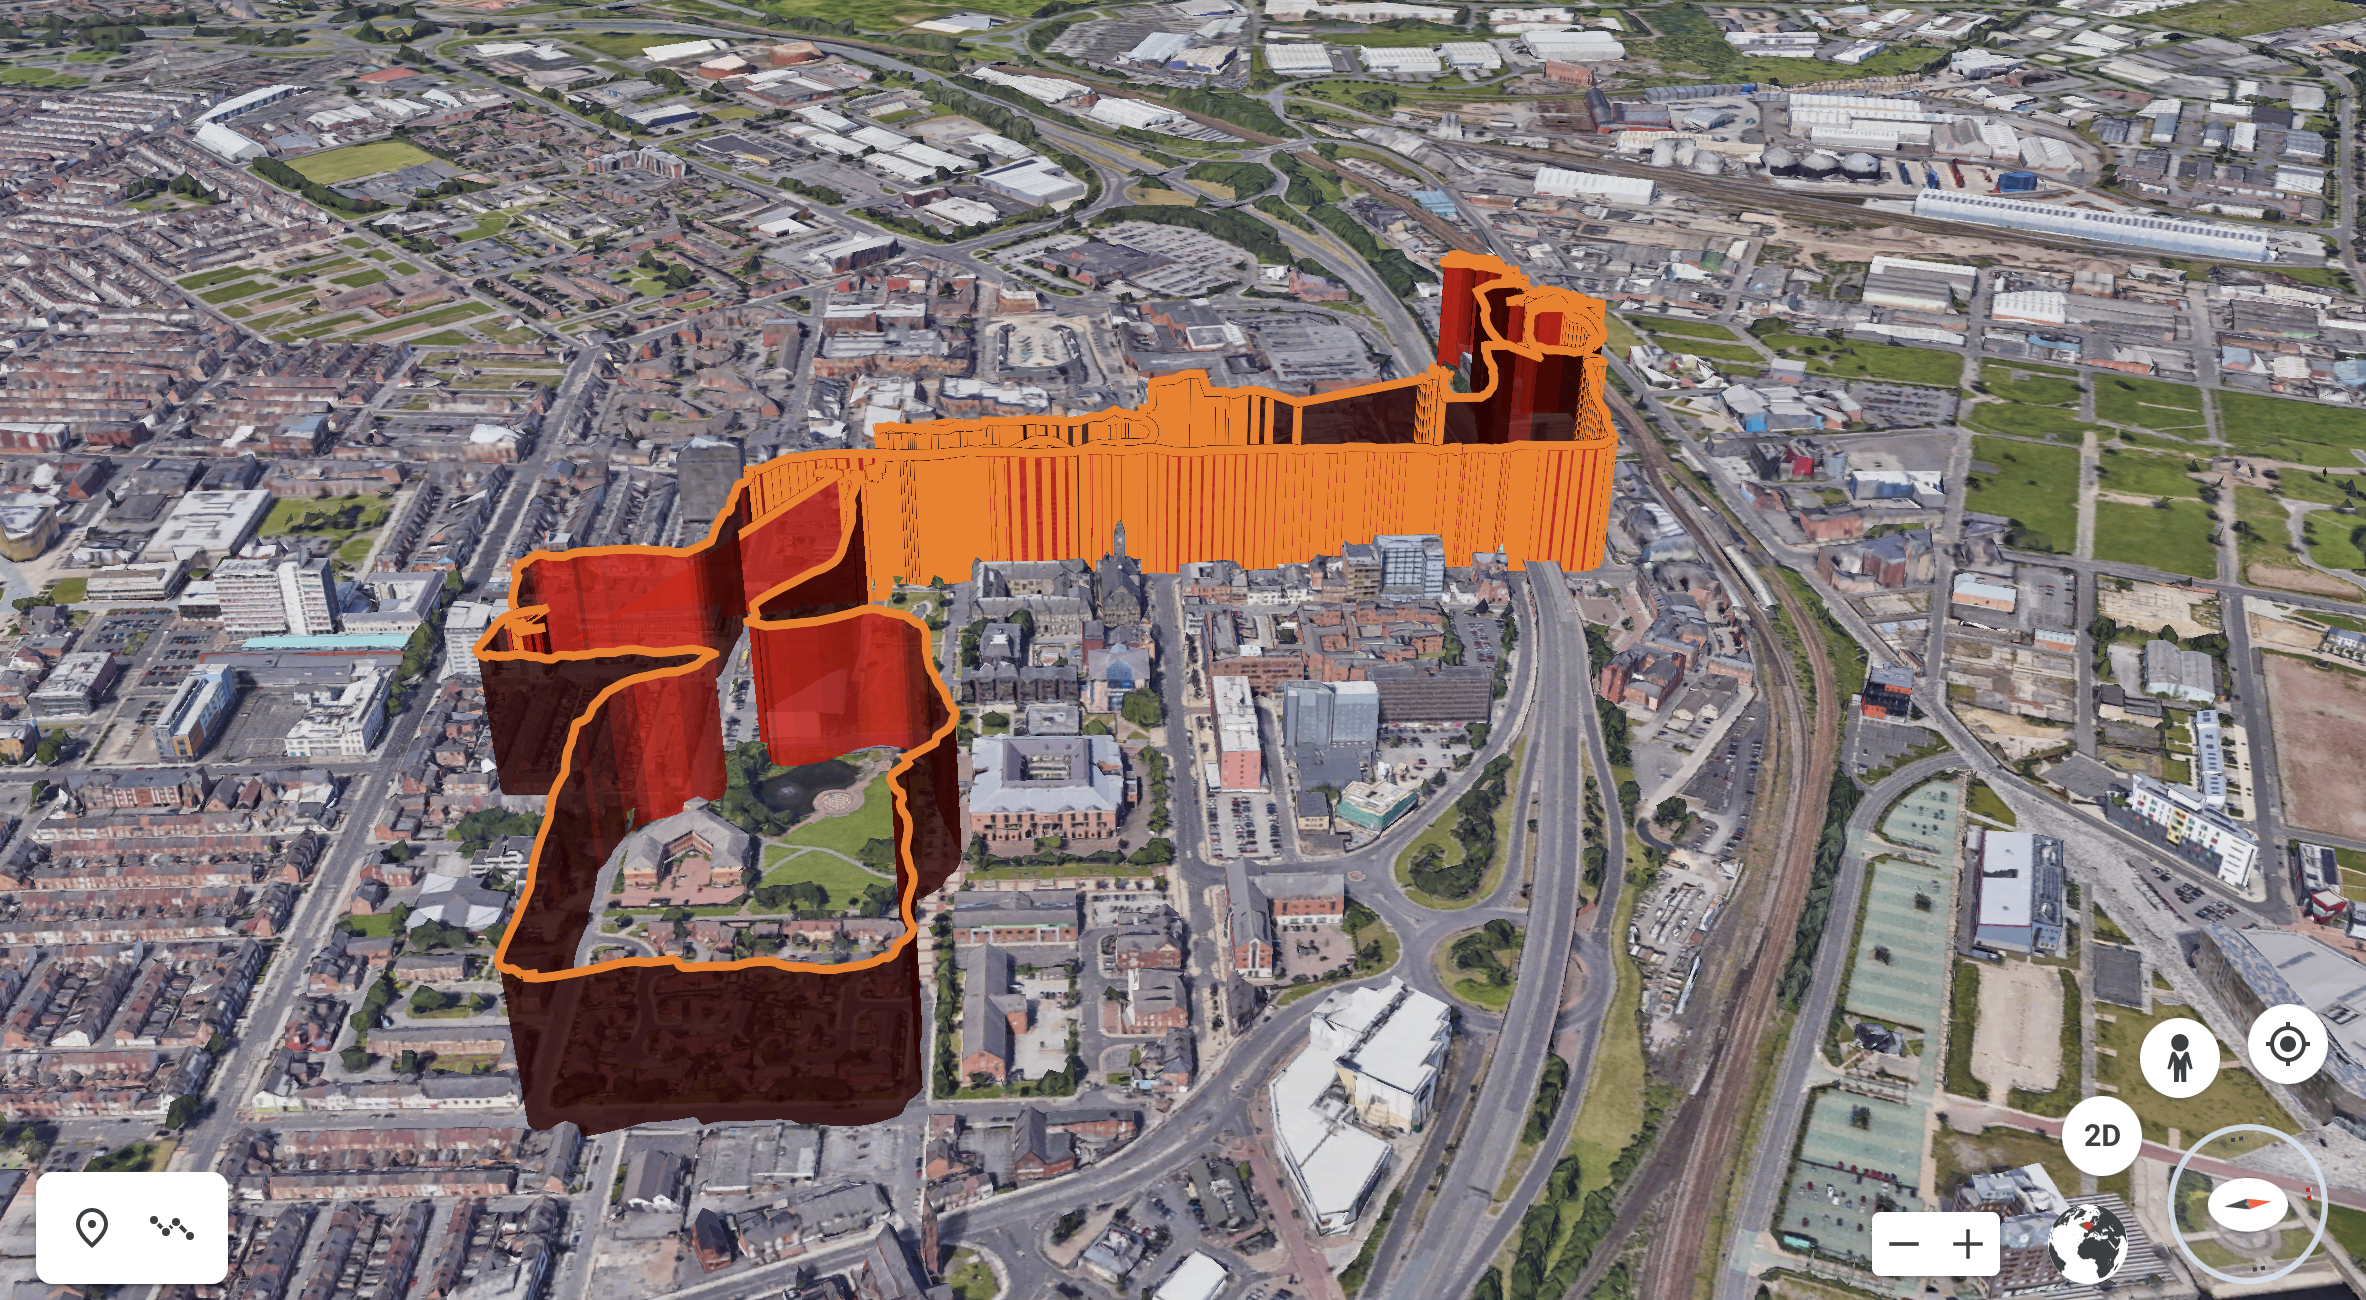
Our sonifications in no scent or colour at SAW21 use PM1, PM2.5, PM10, 0.3+, 0.5+ data. Our visualisations depict PM2.5 levels only.
These numbers refer to the particle size and count range of greater than or less than. 0.3+ and 0.5+ measures capture both the pollutants and organic matter like pollen. PM2.5 measures only the super fine particles that gets into our lungs and bloodstream…
The ‘WHO limit’ shown above is a daily average target / guideline. Our PM2.5 data shows actual, not averaged figures.

