

Mapping the air
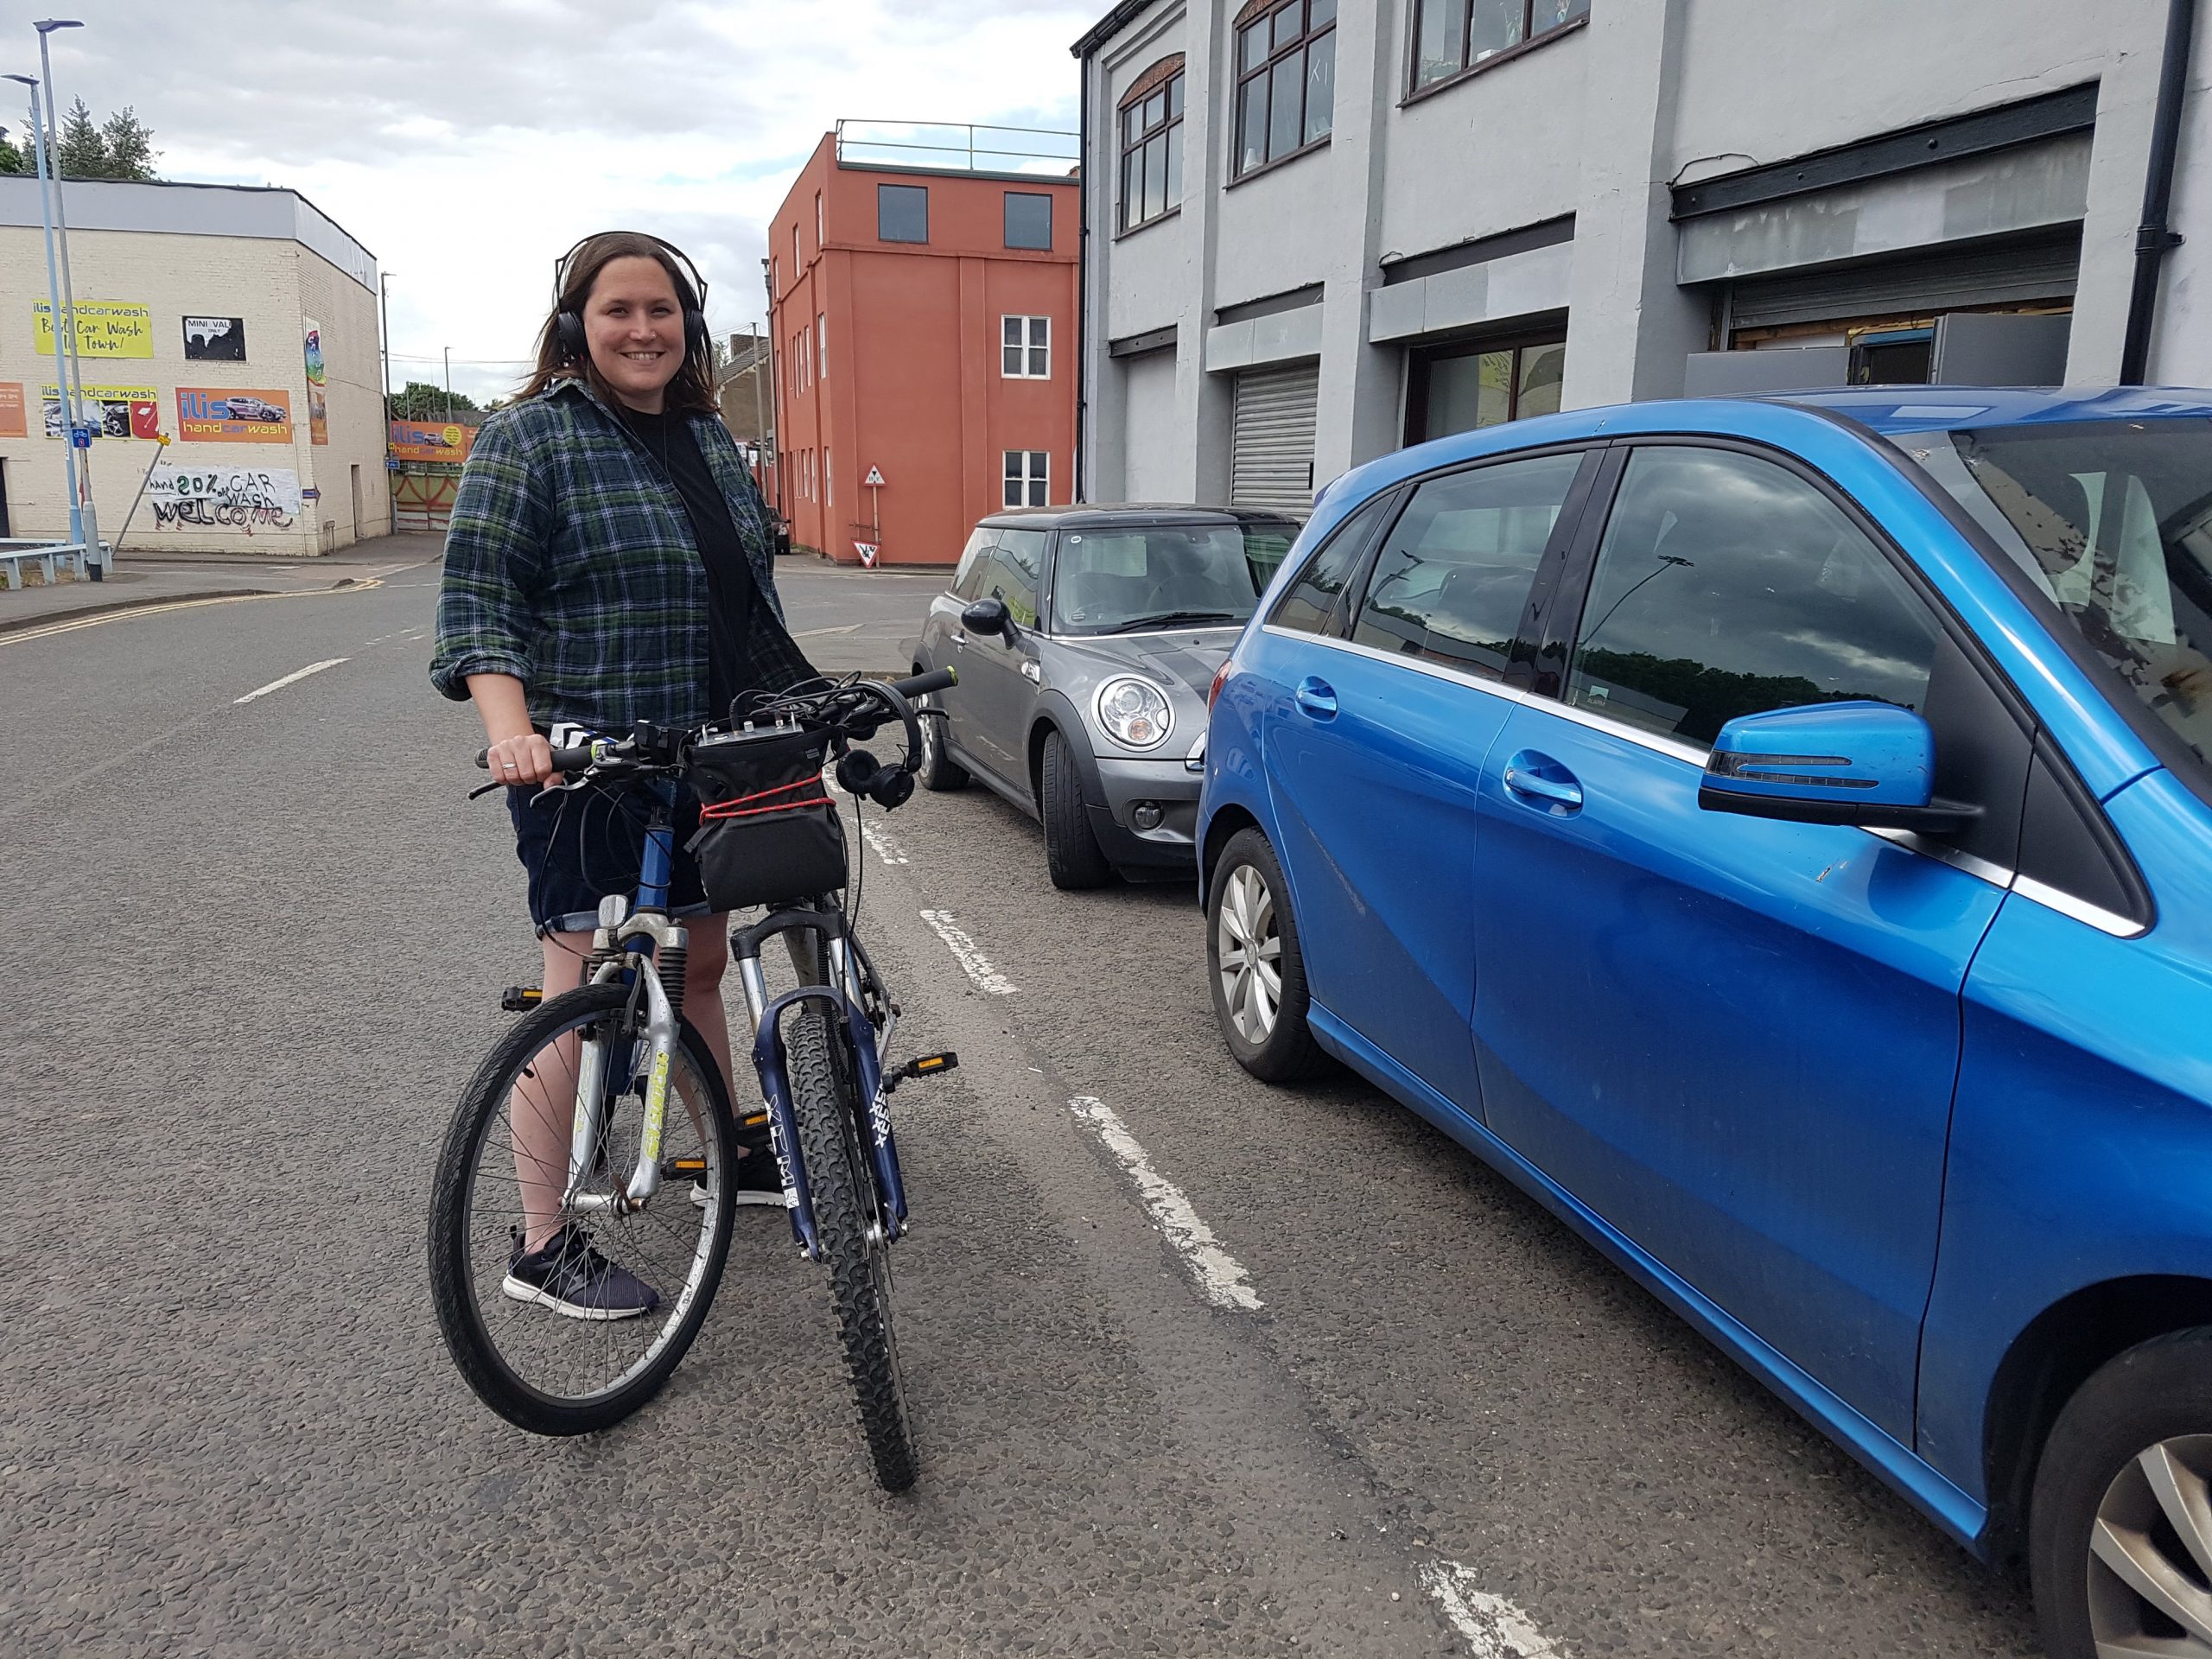
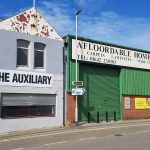
While we grapple with pd and Pis, we’re also out riding each day, collecting as much air pollution data as we can (and scoping out locations to map out voice script).
The sonification is a site specific work for Middlesbrough’s air and so it’s essential that we build up a landscape of data – from different roads, from different times and from different days of the week. We need an understanding of the general range of air, how much is fluctuates on a ride, what values the air is cleanest at, what values the dirtiest peaks reach, where the dirtier bits of air are found, and how often in a 30 min ride you’d experience these.
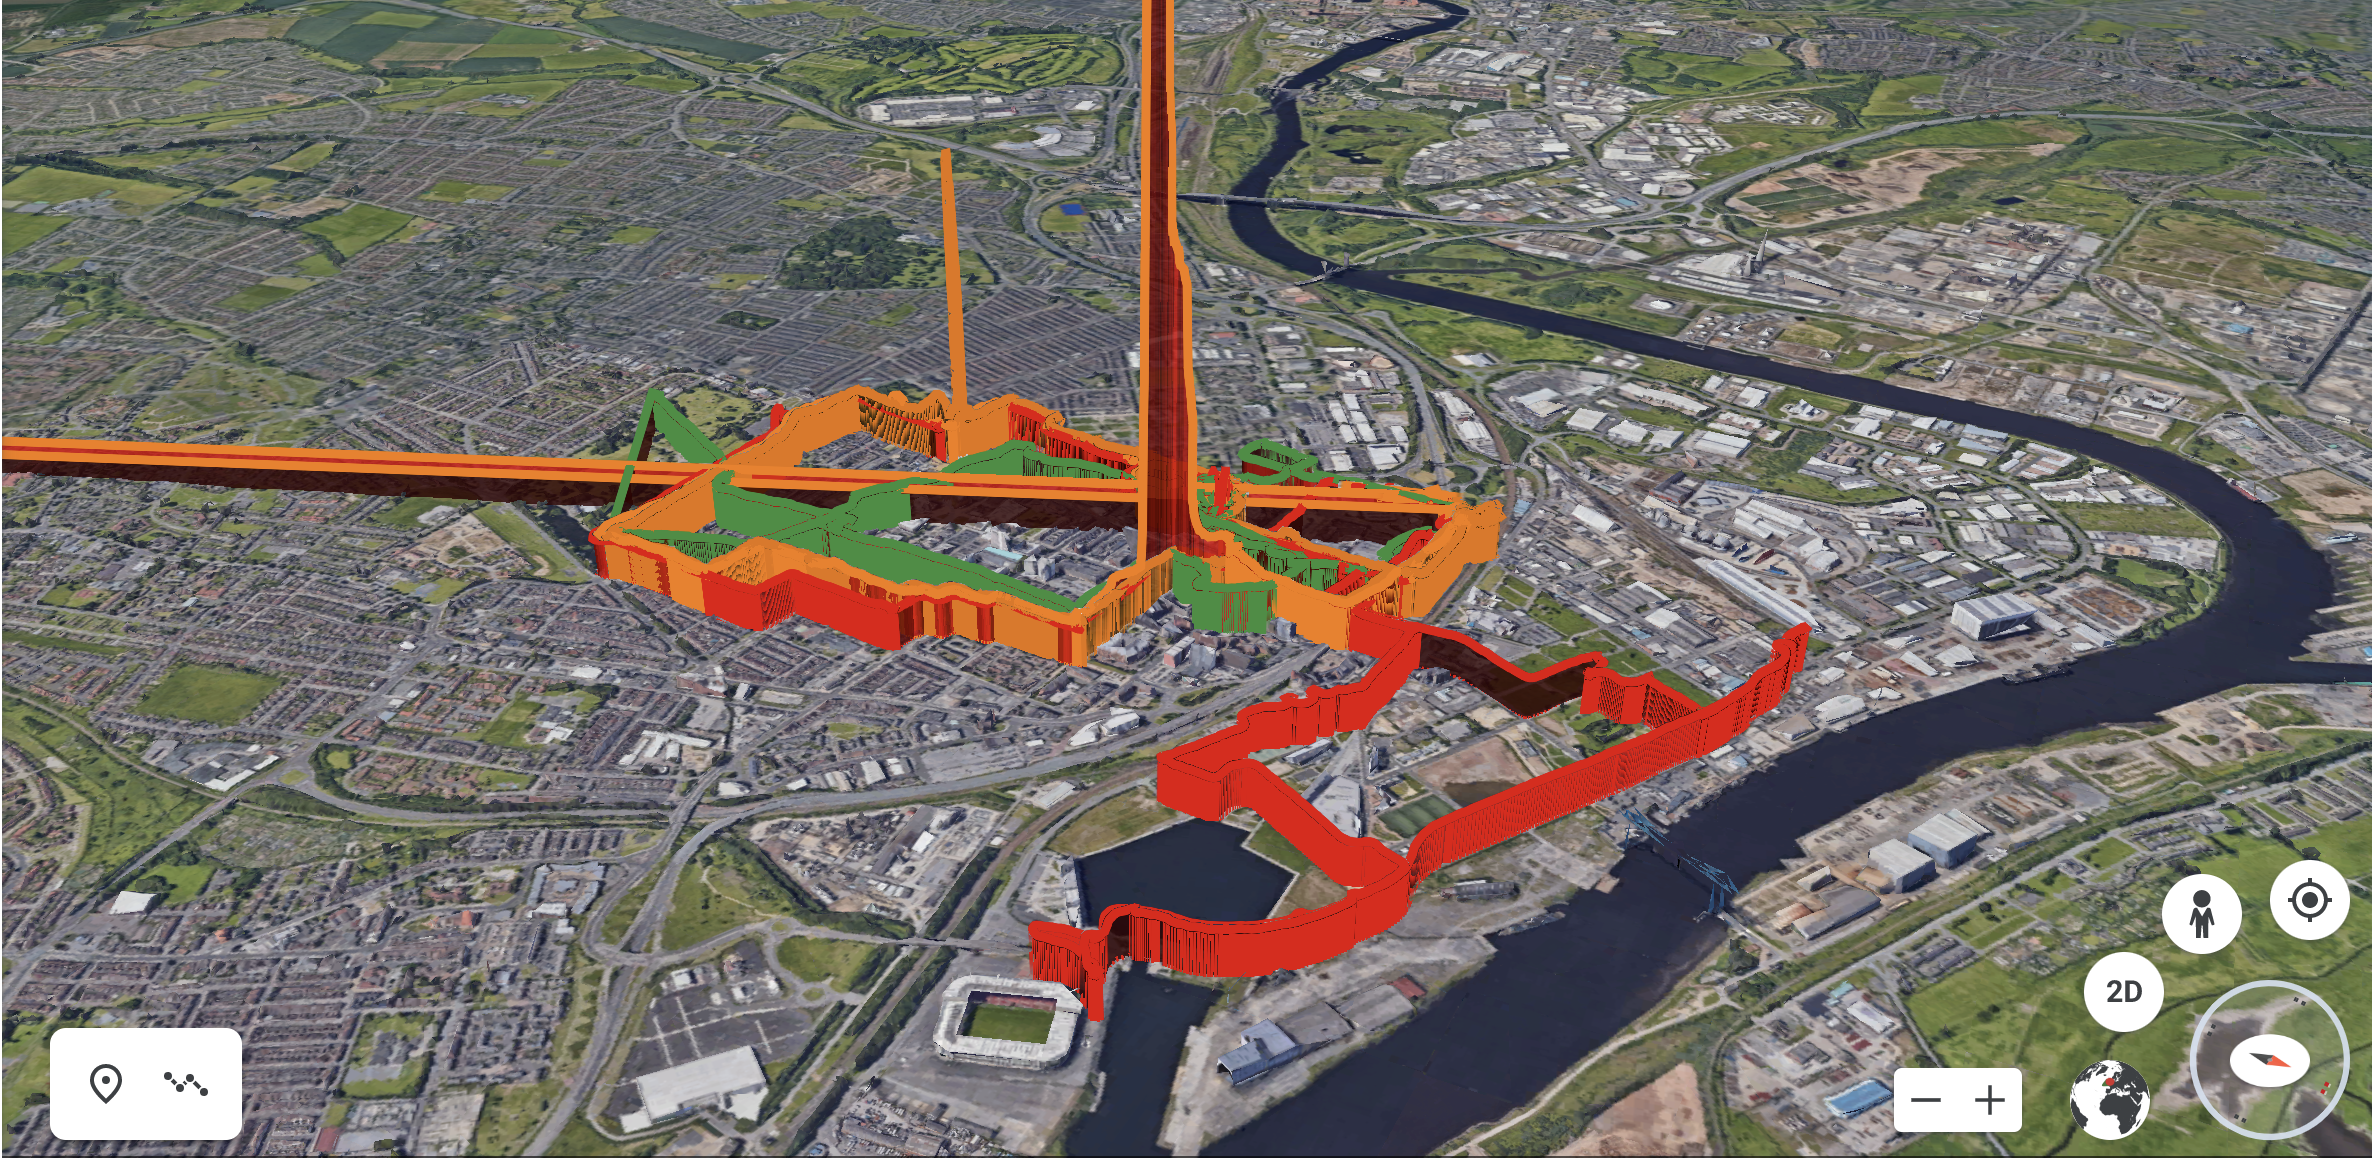
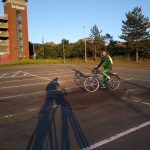
We are riding, riding, riding, listening to the air while as we go, mapping it to graphs and 3d maps back at the studio, then mapping it to our sound synthesis in pd and riding it again.
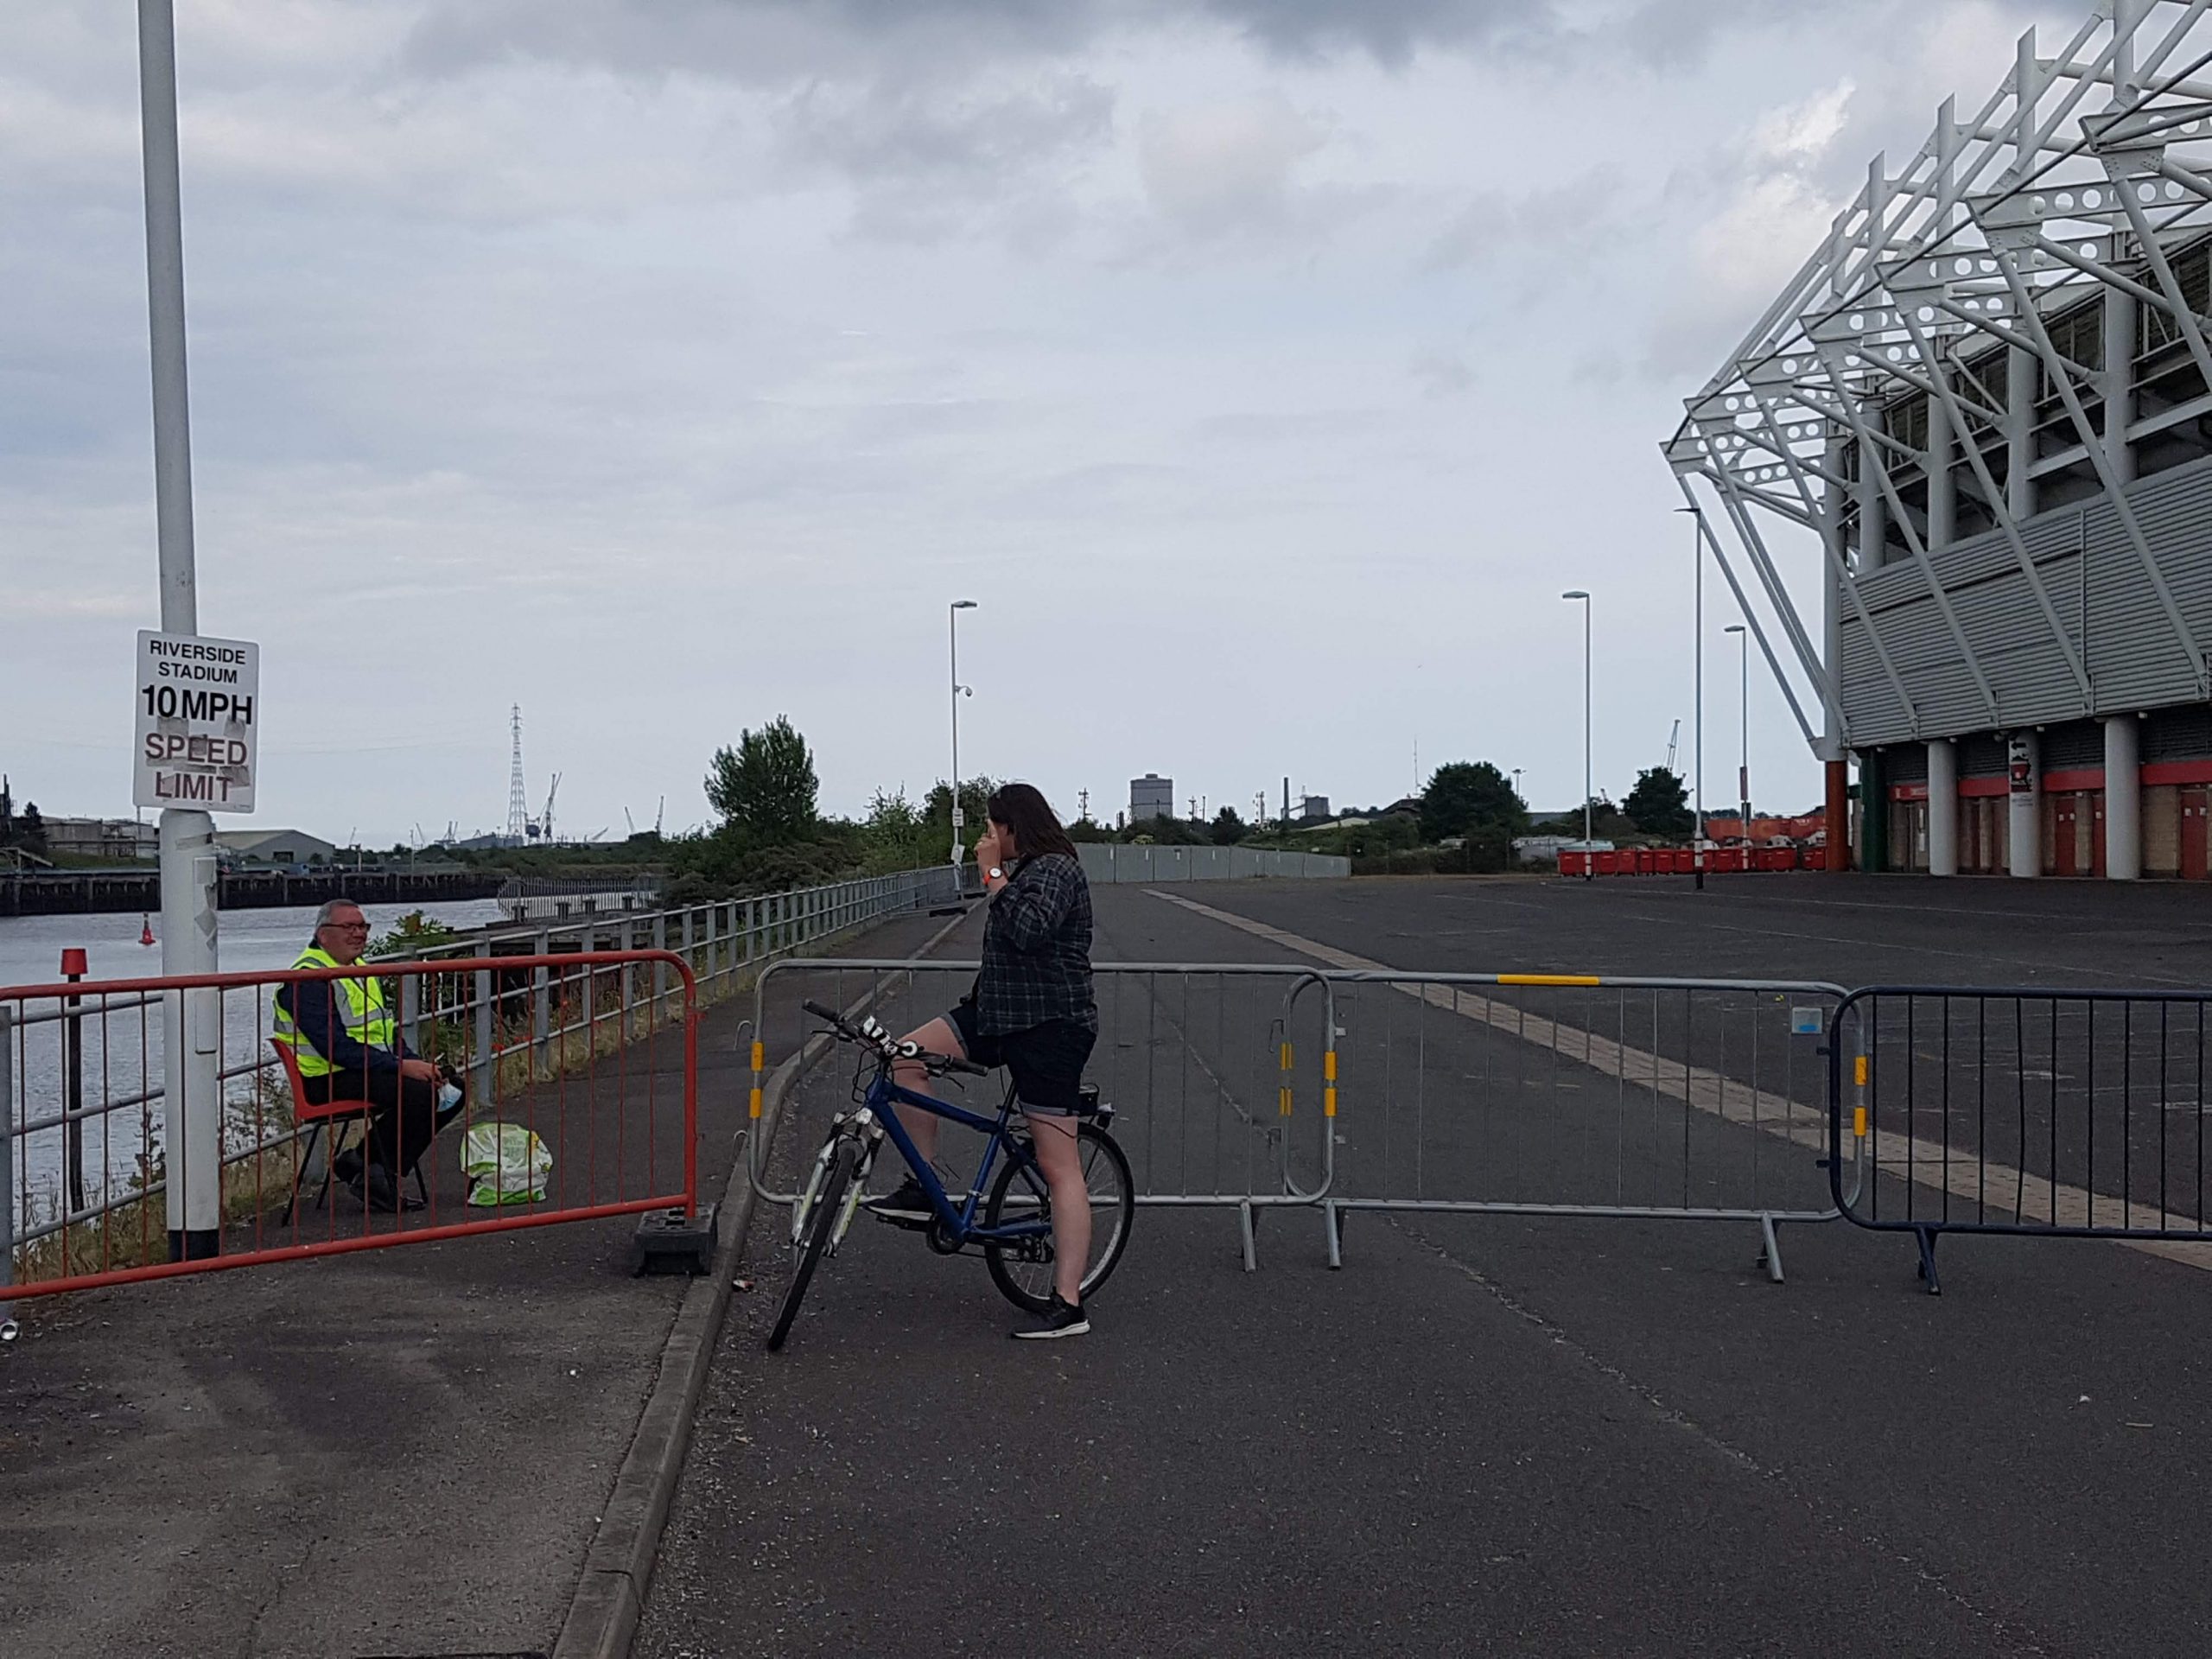
We’re starting to get repeat data – cleaner air out by the river ‘over the border’, dirtier air on the Linthorp rd by the restaurants and in the town centre by the food vans and smokers. Plus a few more super high spikes of PM2.5 get registered but all at different locations, and not repeating in one spot. The weather is changing all week too and we’re trying to keep a track on this to understand the relationship between weather and particular matter pollution. Are the thick clouds increasing pollution levels? Is the wind dispersing the particulate matter?

